Journal of Jilin University(Medicine Edition) ›› 2026, Vol. 52 ›› Issue (5): 1408-1419.doi: 10.13481/j.1671-587X.20260521
• Research in clinical medicine • Previous Articles
Bioinformatics analysis of CGGA database based on transcriptome difference in recurrent glioblastoma and its experimental validation
Yingying ZHANG1,Xue WANG2,Ningbo XU3,Ziqing WU1( )
- 1.Department of Pathology,Integrated Hospital of Traditional Chinese and Western Medicine,Southern Medical University,Guangzhou 510315,China
2.Department of Oncology,Fulin Hospital,Mianyang City,Sichuan Province,Mianyang 621000,China
3.Department of Intervention,Pearl River Hospital,Southern Medical University,Guangzhou 510315,China
-
Received:2025-11-10Accepted:2026-01-18Online:2026-09-28Published:2026-10-15 -
Contact:Ziqing WU E-mail:hailian@fimmu.com

CLC Number:
- R739.4
Cite this article
Yingying ZHANG,Xue WANG,Ningbo XU,Ziqing WU. Bioinformatics analysis of CGGA database based on transcriptome difference in recurrent glioblastoma and its experimental validation[J].Journal of Jilin University(Medicine Edition), 2026, 52(5): 1408-1419.
share this article
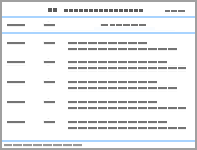
Tab.1
Clinical characteristics of GBM patients"
| Feature | Value |
|---|---|
| Number of patients | 306 |
| Age (x±s, year) | 49.05±0.76 |
| Mean survival time (x±s, d) | 575.79±34.14 |
| Gender | |
| Female | 125 |
| Male | 181 |
| Polygenic risk score | |
| Primary | 203 |
| Recurrent | 103 |
| IDH mutation status | |
| Wildtype | 248 |
| Mutant | 58 |
| Chemotherapy | |
| No | 55 |
| Yes | 251 |
| Radio therapy | |
| No | 40 |
| Yes | 266 |
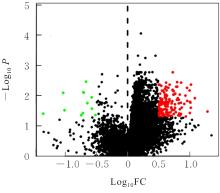
Fig. 1
Volcano map of differentially expressed transcripts of patients in two groups"
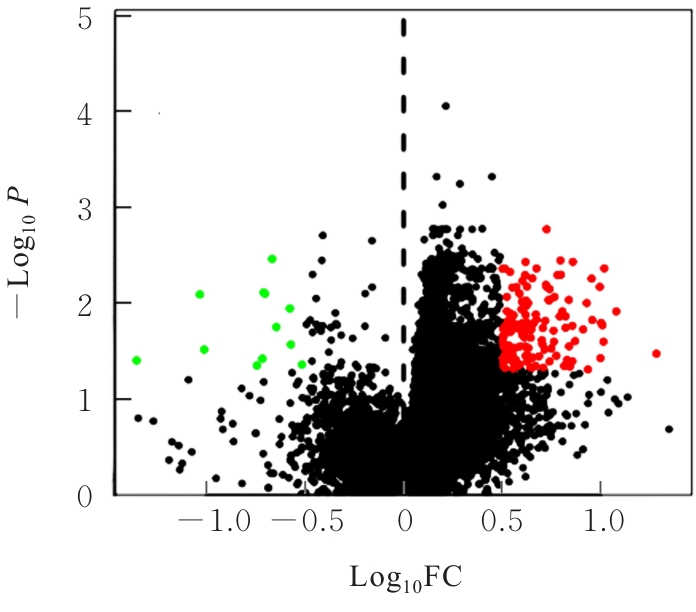
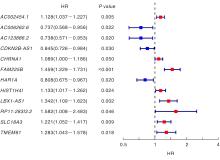
Fig. 2
Screening of DEGs and DELs associated with prognosis of GBM patients by univariate Cox regression analysis"
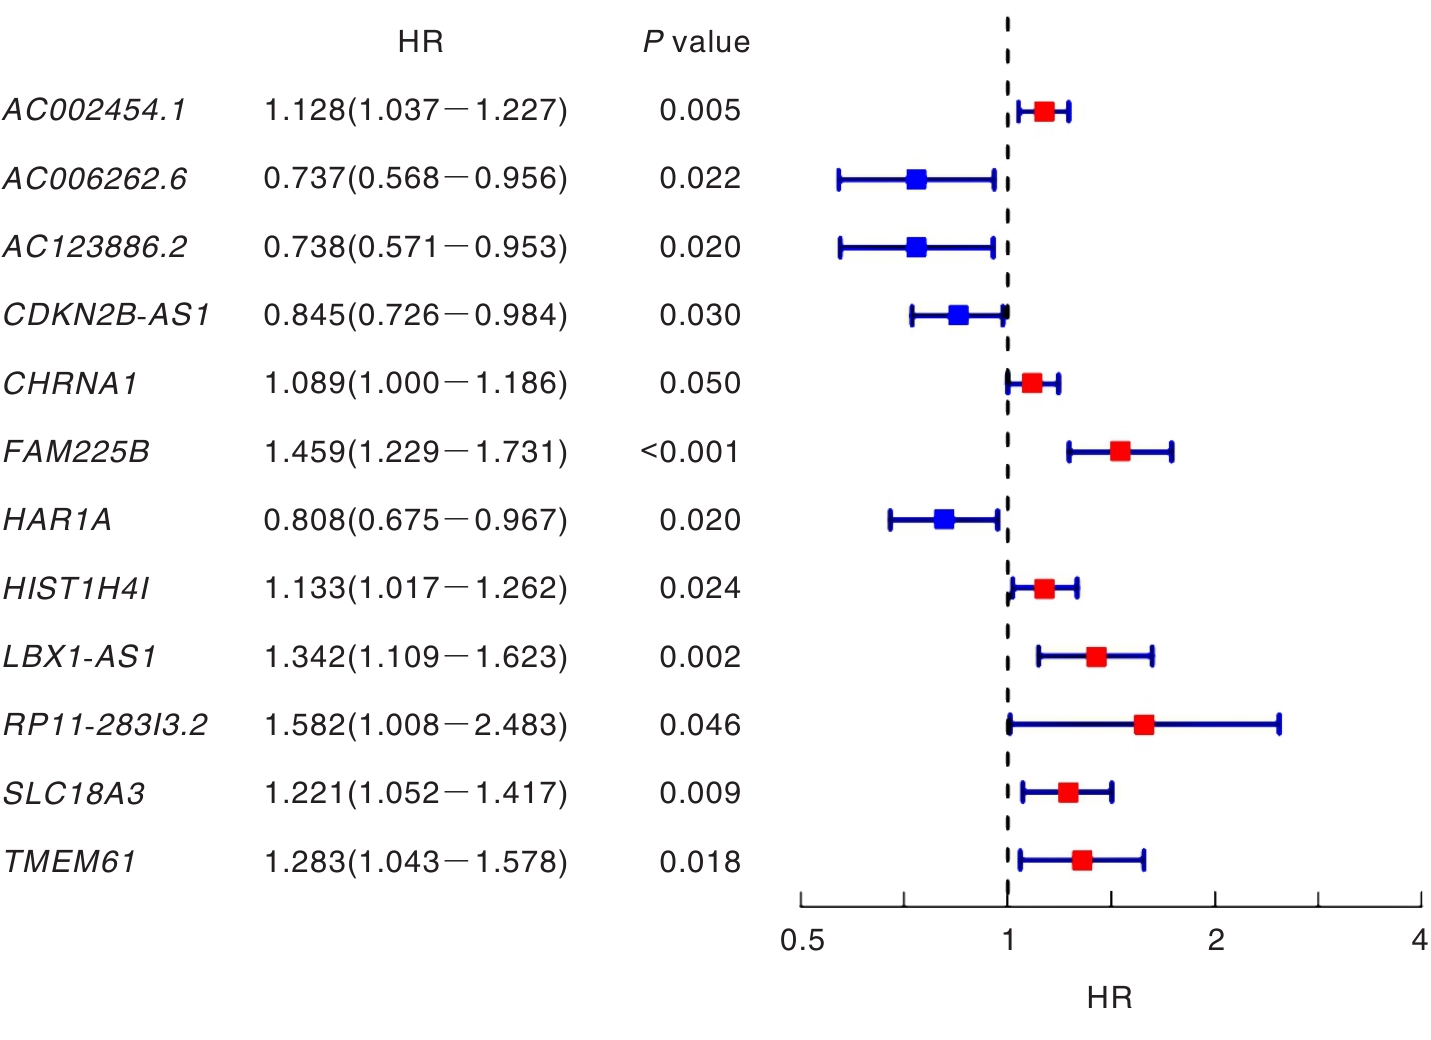
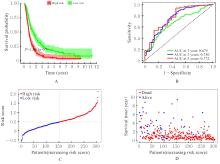
Fig. 3
Predictive values of risk score model for prognosis of GBM patients"
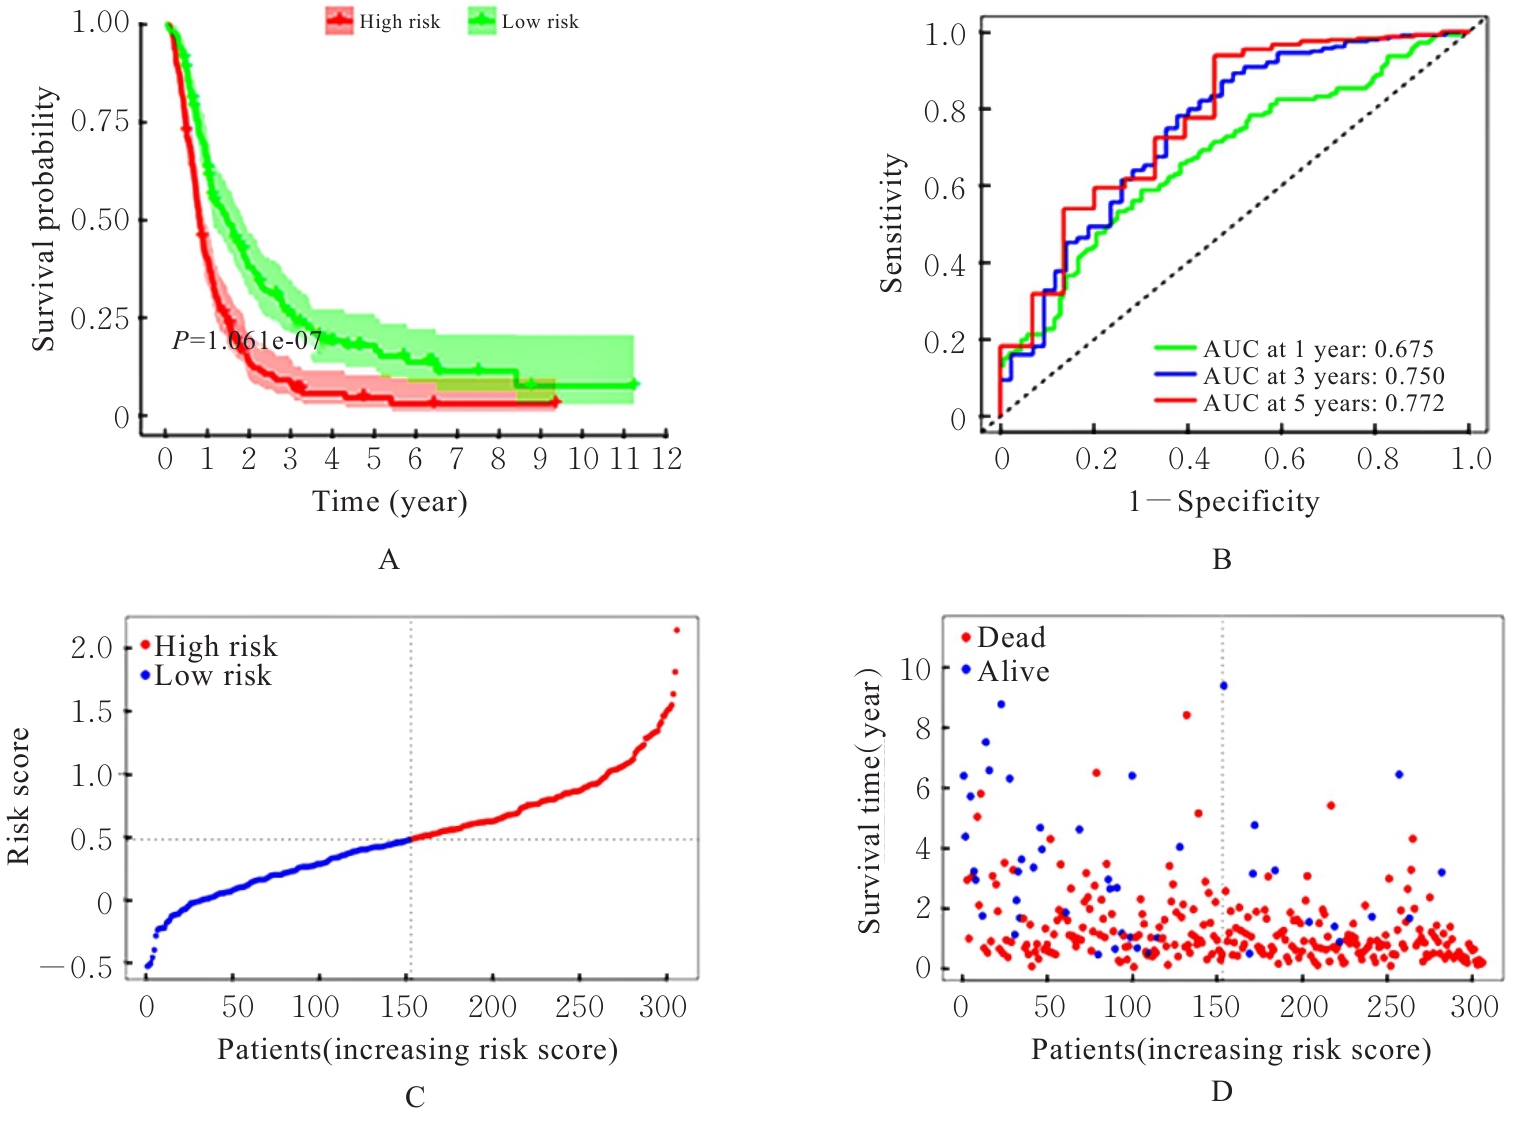
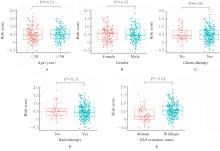
Fig. 4
Risk scores of GBM patients with different clinical and pathological characteristics"
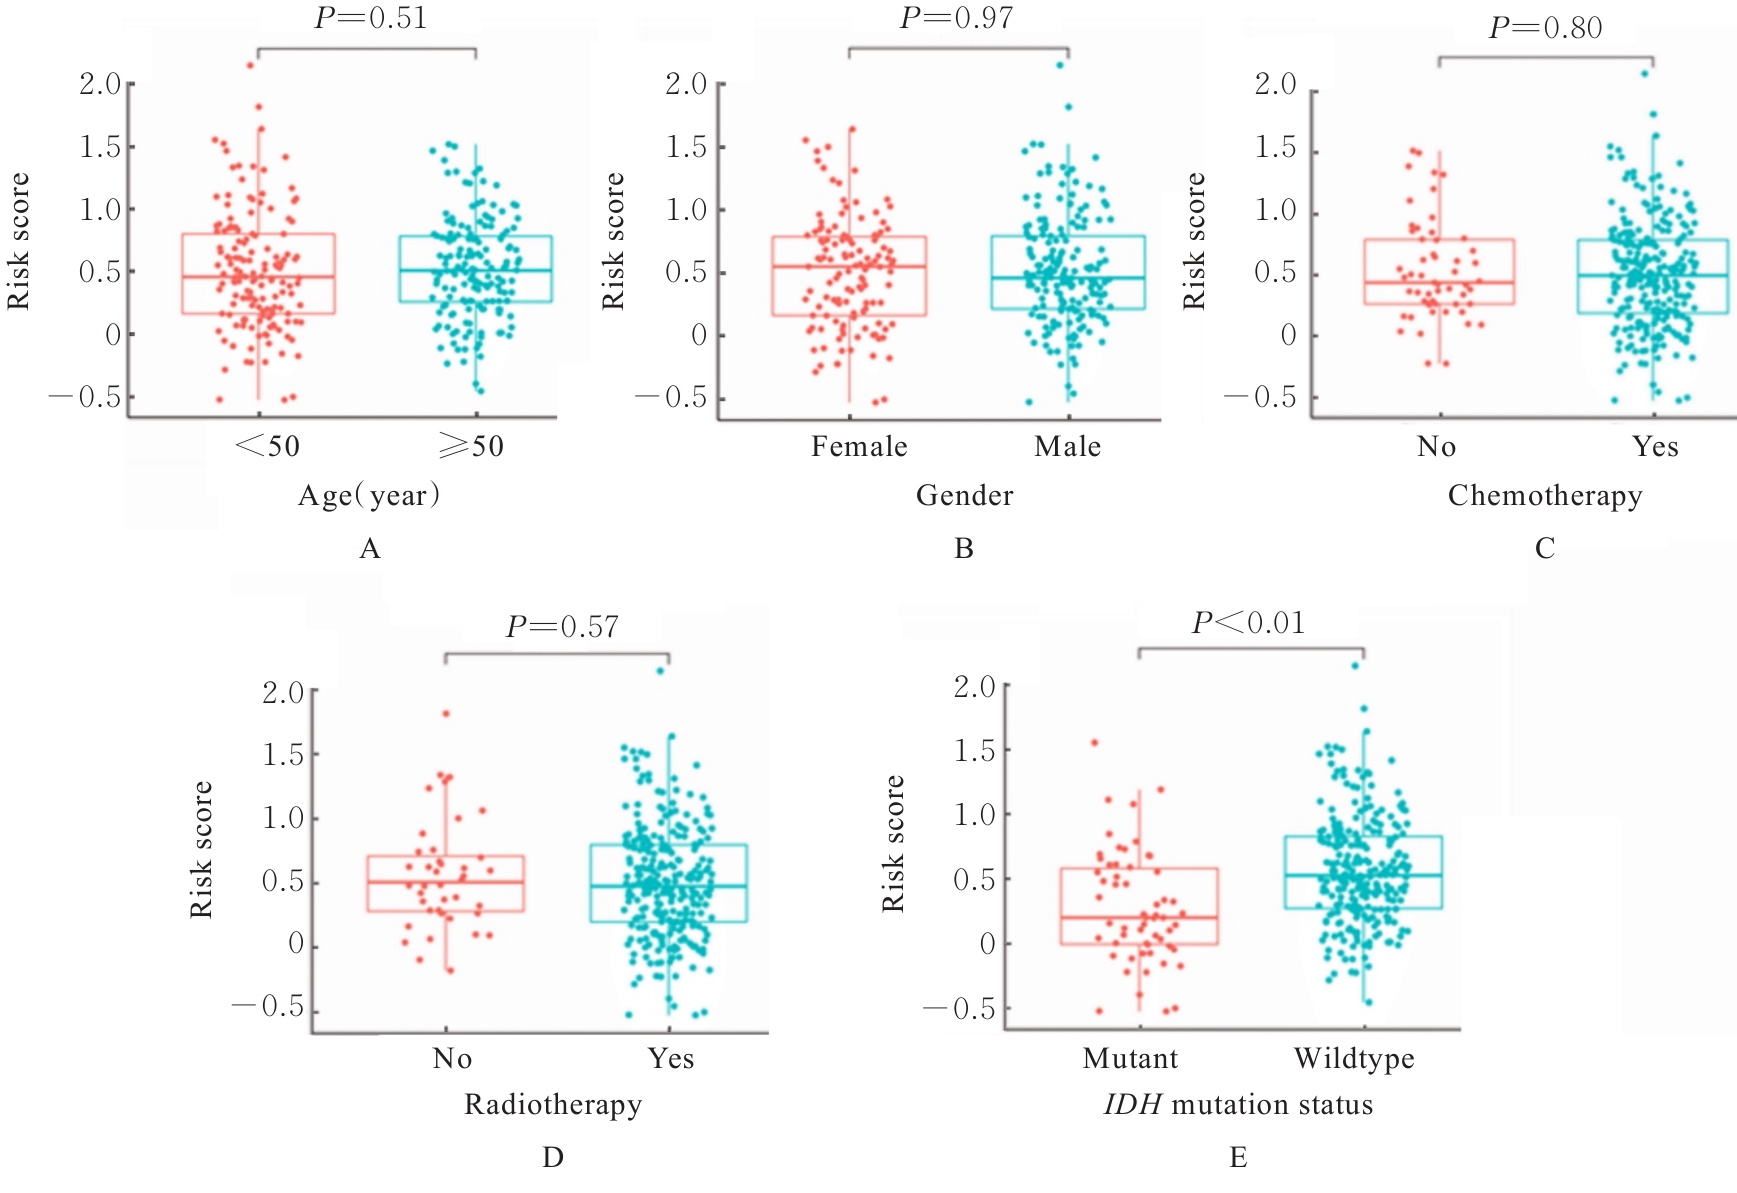
Fig. 5
Expression levels of immune checkpoint genes of patients in low-risk group and high-risk group"
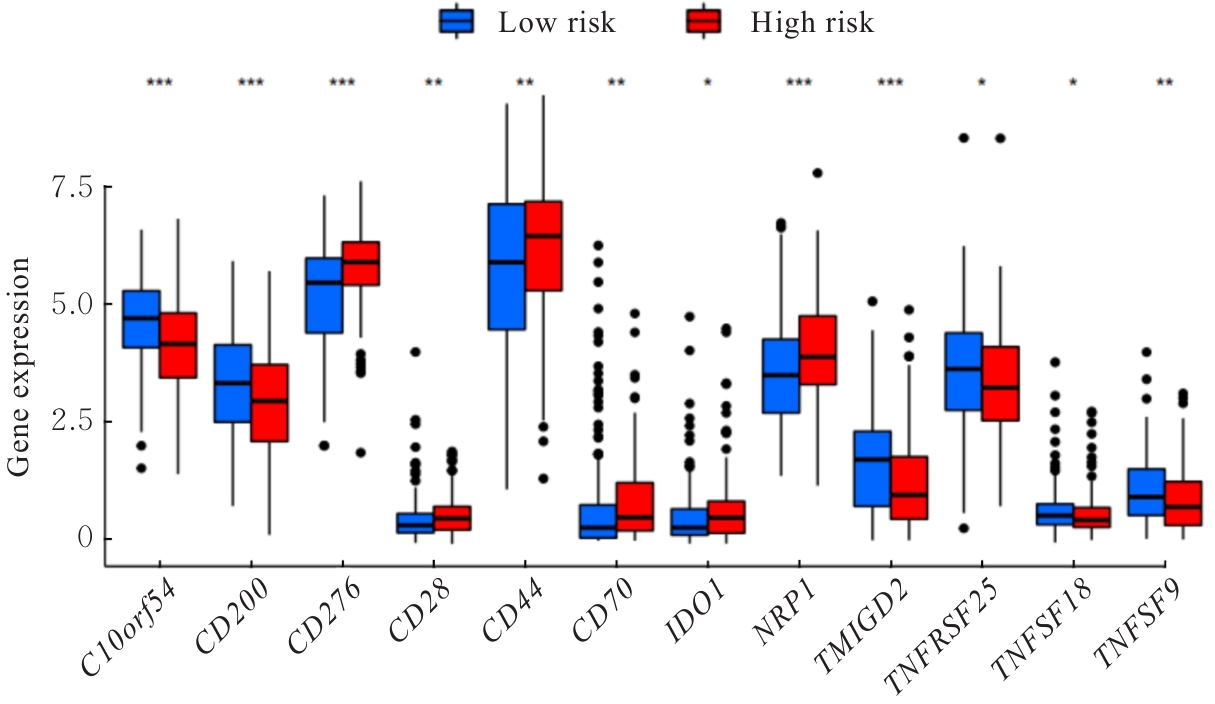
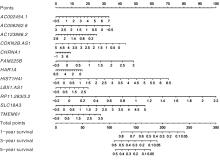
Fig. 6
Nomograms based on 12 prognosis-related DEGs and DELs for predicting 1-, 3-, and 5-year survival probabilities of GBM patients"
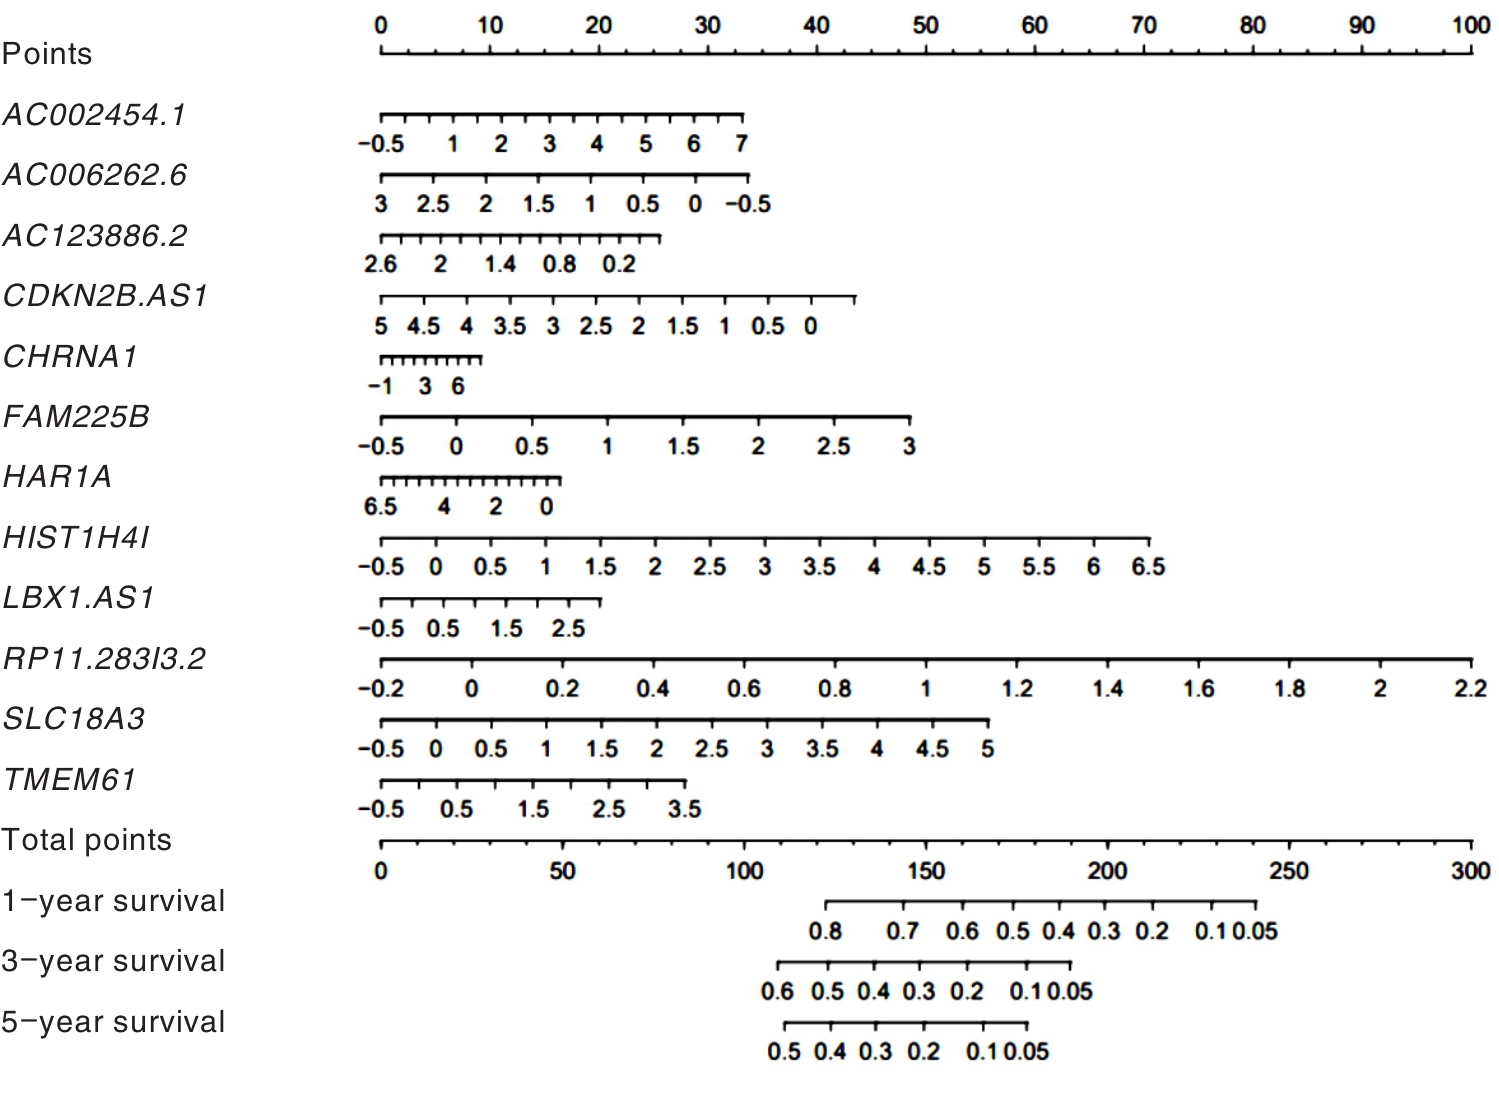
Fig. 7
Survival analysis of GBM patients based on different prognostic gene clusters"
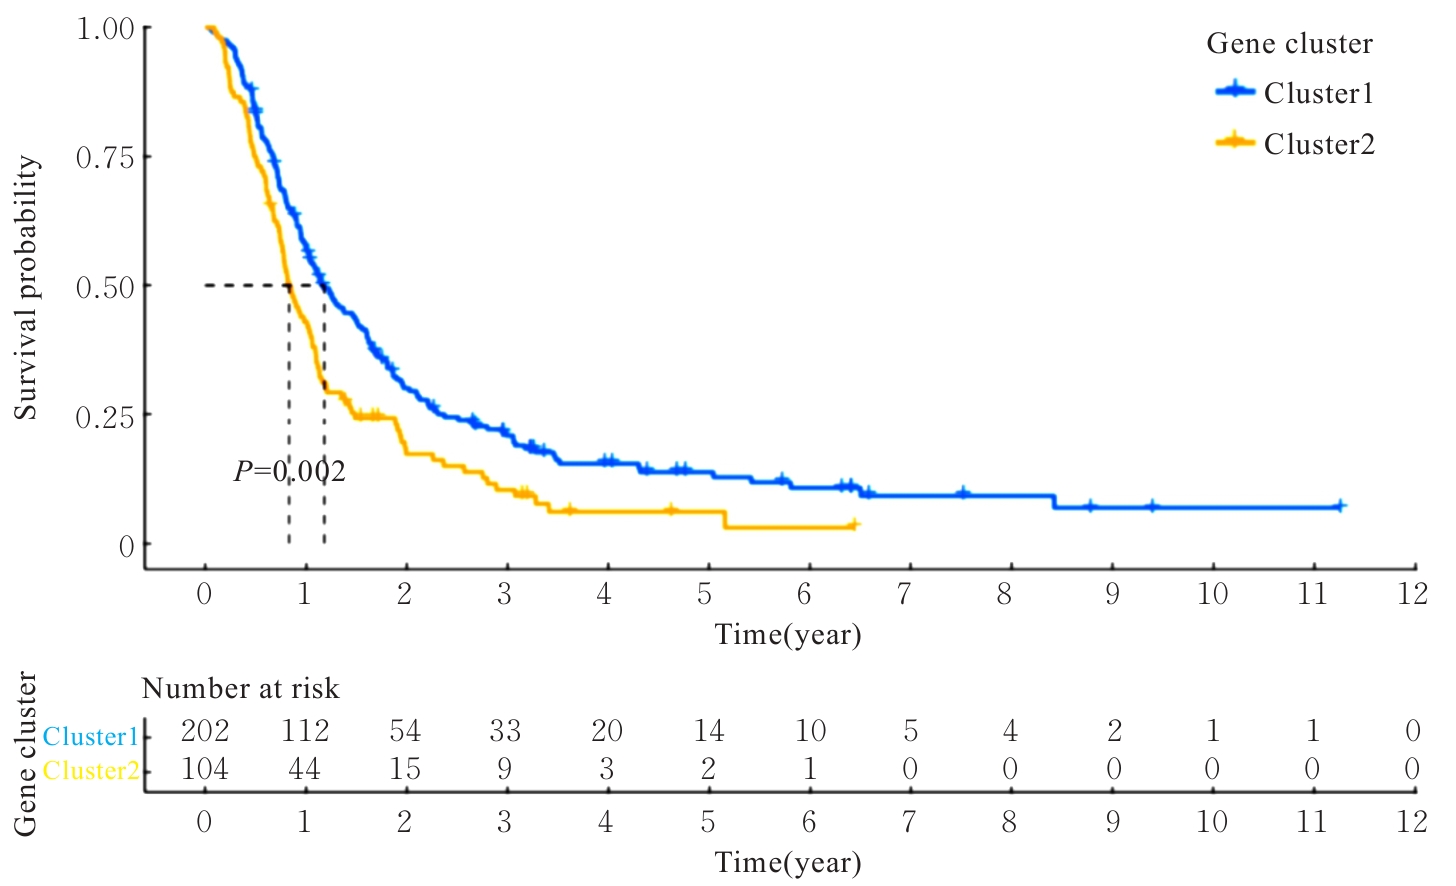
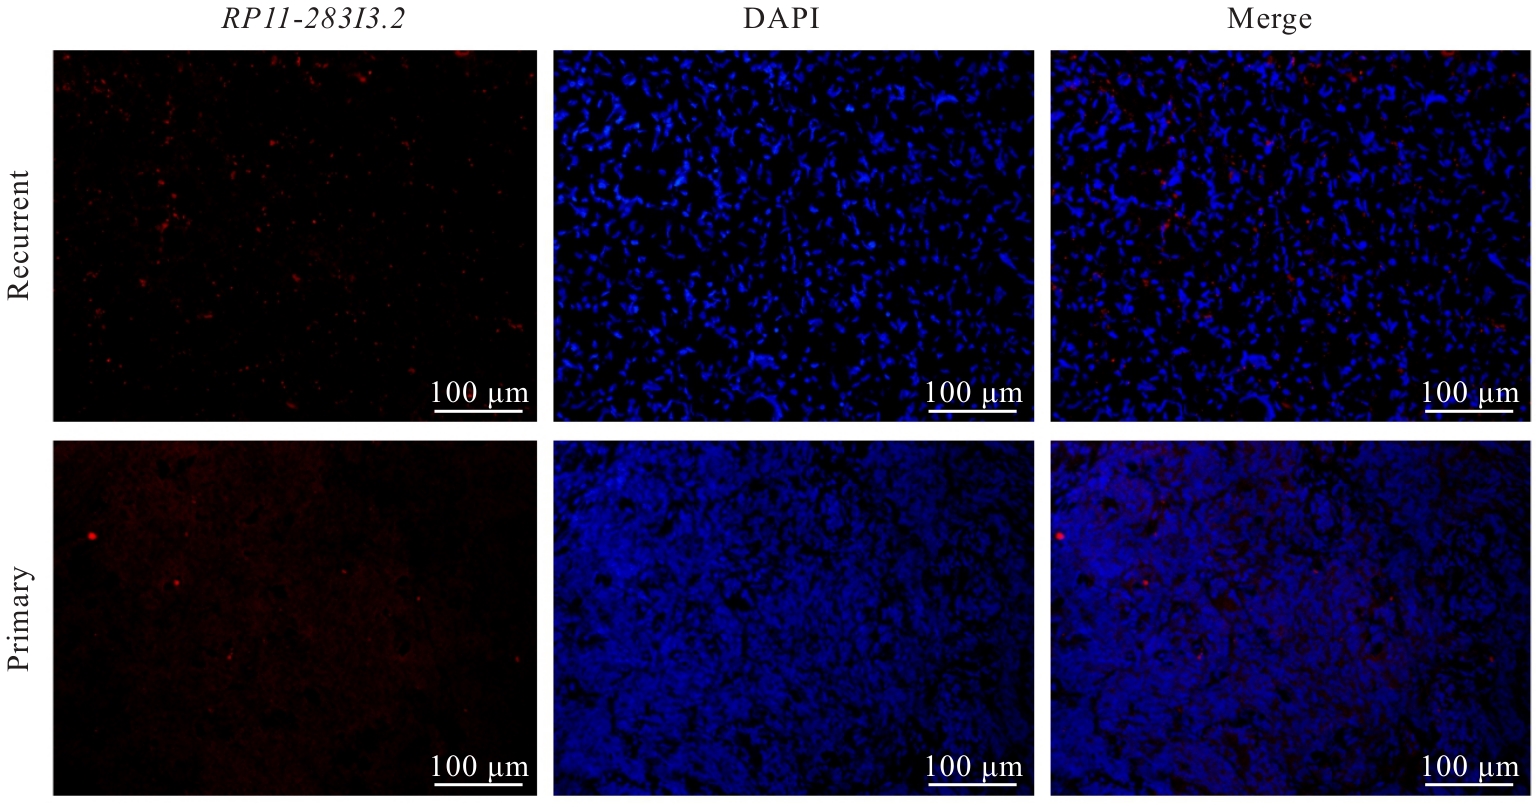
Fig. 8
Expressions of RP11-283I3.2 in tumor tissue of GBM patients in primary group and recurrent group detected by FISH assay"
| [1] | TETZLAFF S K, REYHAN E, LAYER N, et al. Characterizing and targeting glioblastoma neuron-tumor networks with retrograde tracing[J]. Cell, 2025, 188(2): 390-411. |
| [2] | ZHOU F, MUKHERJEE P, MU J M, et al. Therapeutic potential of targeting macrophages and microglia in glioblastoma[J]. Trends Pharmacol Sci, 2025, 46(9): 848-862. |
| [3] | 宋 昆, 秦智勇, 徐 浩, 等. 复发胶质母细胞瘤患者术前MRI强化特征对术后复发时间的预测价值[J]. 中国现代神经疾病杂志, 2019, 19(12): 954-957. |
| [4] | TAN A C, ASHLEY D M, LÓPEZ G Y, et al. Management of glioblastoma: State of the art and future directions[J]. CA Cancer J Clin, 2020, 70(4): 299-312. |
| [5] | DAVIS M. Glioblastoma: overview of disease and treatment[J]. Clin J Oncol Nurs, 2016, 20(5): S2-S8. |
| [6] | VERHAAK R G W, HOADLEY K A, PURDOM E, et al. Integrated genomic analysis identifies clinically relevant subtypes of glioblastoma characterized by abnormalities in PDGFRA, IDH1, EGFR, and NF1[J]. Cancer Cell, 2010, 17(1): 98-110. |
| [7] | WANG Y N, CHEN W Q, SHI Y X, et al. Imposing phase Ⅱ and phase Ⅲ clinical trials of targeted drugs for glioblastoma: current status and progress[J]. Front Oncol, 2021, 11: 719623. |
| [8] | DE BONIS P, ANILE C, POMPUCCI A, et al. The influence of surgery on recurrence pattern of glioblastoma[J]. Clin Neurol Neurosurg, 2013, 115(1): 37-43. |
| [9] | KIM J, LEE I H, CHO H J, et al. Spatiotemporal evolution of the primary glioblastoma genome[J]. Cancer Cell, 2015, 28(3): 318-328. |
| [10] | GALVEZ-CANCINO F, NAVARRETE M, BEATTIE G, et al. Regulatory T cell depletion promotes myeloid cell activation and glioblastoma response to anti-PD1 and tumor-targeting antibodies[J]. Immunity, 2025, 58(5): 1236-1253. |
| [11] | STARK A M, WITZEL P, STREGE R J, et al. p53, mdm2, EGFR, and msh2 expression in paired initial and recurrent glioblastoma multiforme[J]. J Neurol Neurosurg Psychiatry, 2003, 74(6): 779-783. |
| [12] | ESTELLER M, GARCIA-FONCILLAS J, ANDION E, et al. Inactivation of the DNA-repair Gene MGMT and the clinical response of gliomas to alkylating agents[J]. N Engl J Med, 2000, 343(19): 1350-1354. |
| [13] | CAMPOS B, OLSEN L R, URUP T, et al. A comprehensive profile of recurrent glioblastoma[J]. Oncogene, 2016, 35(45): 5819-5825. |
| [14] | TU Z W, XIONG H F, QIU Y, et al. Limited recurrence distance of glioblastoma under modern radiotherapy era[J]. BMC Cancer, 2021, 21(1): 720. |
| [15] | CHEN W L, WANG Y K, ZHAO B H, et al. Optimal therapies for recurrent glioblastoma: a Bayesian network meta-analysis[J]. Front Oncol, 2021, 11: 641878. |
| [16] | LI Y N, WANG F, LI B. Photodynamic therapy during second surgery for recurrent gliomas improves survival[J]. Photodiagn Photodyn Ther, 2022, 38: 102754. |
| [17] | 魏成龙, 王安美, 刘昭前, 等. 多组学分析揭示AFAP1L1作为胶质瘤预后标志物及免疫相关治疗靶点的作用[J]. 中南大学学报(医学版), 2025, 50(12): 2141-2157. |
| [18] | YADAV B, PAL S, RUBSTOV Y, et al. LncRNAs associated with glioblastoma: From transcriptional noise to novel regulators with a promising role in therapeutics[J]. Mol Ther Nucleic Acids, 2021, 24: 728-742. |
| [19] | FANG Z B, WENG Y X, XIAO F, et al. LncRNA RP11-390F4.3 inhibits invasion and migration of glioblastoma cells by downregulating ROCK1[J]. Neuroreport, 2021, 32(10): 888-893. |
| [20] | LIU Y T, XU N B, LIU B Y, et al. Long noncoding RNA RP11-838N2.4 enhances the cytotoxic effects of temozolomide by inhibiting the functions of miR-10a in glioblastoma cell lines[J]. Oncotarget, 2016, 7(28): 43835-43851. |
| [21] | 孙宏瑜. m6A甲基化修饰调控RP11-150O12.3在结肠癌中的表达及其对结肠癌的生物学功能研究[D]. 石家庄: 河北医科大学, 2021. |
| [22] | GIRO-PERAFITA A, LUO L, KHODADADI-JAMAYRAN A, et al. LncRNA RP11-19E11 is an E2F1 target required for proliferation and survival of basal breast cancer[J]. NPJ Breast Cancer, 2020, 6: 1. |
| [23] | 唐 迪, 左其明, 张 佼, 等. lncRNA RP11-374M1.2通过上调LKB1基因表达抑制前列腺癌细胞的侵袭和增殖[J]. 山西医科大学学报, 2020, 51(10): 1042-1046. |
| [24] | LIU J, WANG Y, CHEN P, et al. AC002454.1 and CDK6 synergistically promote endometrial cell migration and invasion in endometriosis[J]. Reproduction, 2019, 157(6): 535-543. |
| [25] | MARTINEZ L, TABBARA M, DUQUE J C, et al. Transcriptomics of human arteriovenous fistula failure: genes associated with nonmaturation[J]. Am J Kidney Dis, 2019, 74(1): 73-81. |
| [26] | PAUL Y, THOMAS S, PATIL V, et al. Genetic landscape of long noncoding RNA (lncRNAs) in glioblastoma: identification of complex lncRNA regulatory networks and clinically relevant lncRNAs in glioblastoma[J]. Oncotarget, 2018, 9(51): 29548-29564. |
| [27] | 姜崇发, 王秋红, 刘 建, 等. 依托咪酯通过调控LncRNA CDKN2B-AS1/miR-199a-5p表达抑制胶质瘤细胞增殖、 迁移和侵袭[J]. 中国老年学杂志, 2022, 42(2): 349-355. |
| [28] | LU J C, CHEN Y J, WEN L B, et al. LncRNA CDKN2B-AS1 contributes to glioma development by regulating the miR-199a-5p/DDR1 axis[J]. J Gene Med, 2022, 24(1): e3389. |
| [29] | 何思琦, 杨 曼, 杨 莹, 等. miR-129和CDKN2B-AS1基因多态性与云南汉族人群2型糖尿病发病风险的相关性[J]. 贵州医科大学学报, 2021, 46(5): 497-503, 510. |
| [30] | LI J S, ZHANG Q, GE P C, et al. FAM225B is a prognostic lncRNA for patients with recurrent glioblastoma[J]. Dis Markers, 2020, 2020: 8888085. |
| [31] | WATERS E, PUCCI P, HIRST M, et al. HAR1: an insight into lncRNA genetic evolution[J]. Epigenomics, 2021, 13(22): 1831-1843. |
| [32] | HUANG K B, YUE X Y, ZHENG Y F, et al. Development and validation of an mesenchymal-related long non-coding RNA prognostic model in glioma[J]. Front Oncol, 2021, 11: 726745. |
| [33] | AI Y L, WEI H G, WU S Y, et al. Exosomal LncRNA LBX1-AS1 derived from RBPJ overexpressed-macrophages inhibits oral squamous cell carcinoma progress via miR-182-5p/FOXO3[J]. Front Oncol, 2021, 11: 605884. |
| [34] | 廖芷吟. CHRNA1对肌肉减少症的影响及其机制探讨[D]. 重庆: 重庆医科大学, 2021. |
| [35] | 梅 杨. OATP1B1,MDR1,和CHRNA1基因多态对罗库溴铵肌松效应的影响[D]. 长沙: 中南大学, 2014. |
| [36] | AIHEMAITI A, YAMAMOTO N, PIAO J Y, et al. A novel PAI-1 inhibitor prevents ageing-related muscle fiber atrophy[J]. Biochem Biophys Res Commun, 2021, 534: 849-856. |
| [37] | MEDINA-AGUILAR R, PÉREZ-PLASENCIA C, MARCHAT L A, et al. Methylation landscape of human breast cancer cells in response to dietary compound resveratrol[J]. PLoS One, 2016, 11(6): e0157866. |
| [38] | VAROL N, KELES İ, YILDIZ H, et al. Methylation analysis of histone 4-related gene HIST1H4F and its effect on gene expression in bladder cancer[J]. Gene, 2023, 866: 147352. |
| [39] | LI J X, HUAN J, YANG F, et al. Identification and validation of a seizure-free-related gene signature for predicting poor prognosis in lower-grade gliomas[J]. Int J Gen Med, 2021, 14: 7399-7410. |
|
||