Journal of Jilin University(Engineering and Technology Edition) ›› 2021, Vol. 51 ›› Issue (2): 575-582.doi: 10.13229/j.cnki.jdxbgxb20200032

Previous Articles    

Modeling and analysis of road speed micro model in long straight line section of desert

Fang WANG(),Jia HU,Sheng JING,Wei CHENG,Xiao-ying HE,Xiao-guang LI   

  1. School of Civil Engineering and Hydraulic Engineering,Ningxia University,Yinchuan 750021,China
  • Received:2020-01-14 Online:2021-03-01 Published:2021-02-09

Abstract:

In order to explore the running speed mesoscopic change of vehicles in the long line segment of desert steppe, the lines’ alignment elements data and the running speed of the vehicles under free-flow are collected in Wuhai-Maqing expressway and national trunk highway 110 in Ningxia. First, in order to reduce the interference of redundant factors in the analysis process, it is assumed that the vehicles’ running speed model in the straight segment is divided into acceleration, constant speed and deceleration. Second, and the parameters related to the max driving speed are regressed and analyzed respectively. Third, the mesoscopic model of the running speed is established in the straight segment of the desert grassland. Furthermore, considering the changes of the longitudinal section and downhill of the long straight section within the slope [2%, 3%], the velocity models of the uphill and downhill sections are modified, respectively. Finally, the effectiveness and reliability of the running speed models are determined by comparing the measured running speed with the model speed of the road. The conclusions of this study provide theoretical basis for the highway alignment design and speed control of long line segment of desert steppe highway.

Key words: desert highway, long line segment, regression analysis, running speed model

CLC Number: 

  • U41

Fig.1

Vehicle speed change diagram of driver on straight section"

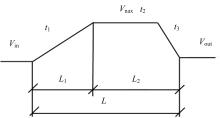
Fig.2

Running speed hypothesis model of line segment"

Table 1

Sample table of test roads"

路段方向设计速度 /(km·h-1坡度 /%

直线段最

大长度/m

直线段最小长度/m
国道110银川-青铜峡802~3.72495028
青铜峡-银川2~5.52
乌玛高速银川-大武口1202~3.80500053
大武口-青铜峡2~3.77

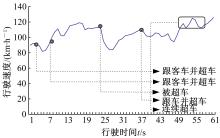
Fig.3

Special behavior of driver during normal driving"

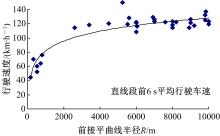
Fig.4

Average velocity before 6 s when entering line is affected by radius of front horizontal curve"

Fig.5

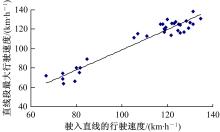
Max running speed and line' speed"

Table 2

Max running speed and corresponding running time under different lengths of line (N=36)"

直线长度 /mVmax/(km·h-1)t1/s直线长度 /mVmax/(km·h-1)t1/s
1342124.713706128.77
1012126.774247130.722
1940119.7152390130.315
2249138202003125.319
125512515495125.73
107511999401209
942113.710910111.78
663115.541062120.25
1735117171100118.78
10451137202662
645116.310450807
106211715405894
1438126.724202752
1135125.710557804
2194121.32229174.54
1040125.32013863.55
1922127.718138725
708125.37291694

Fig.6

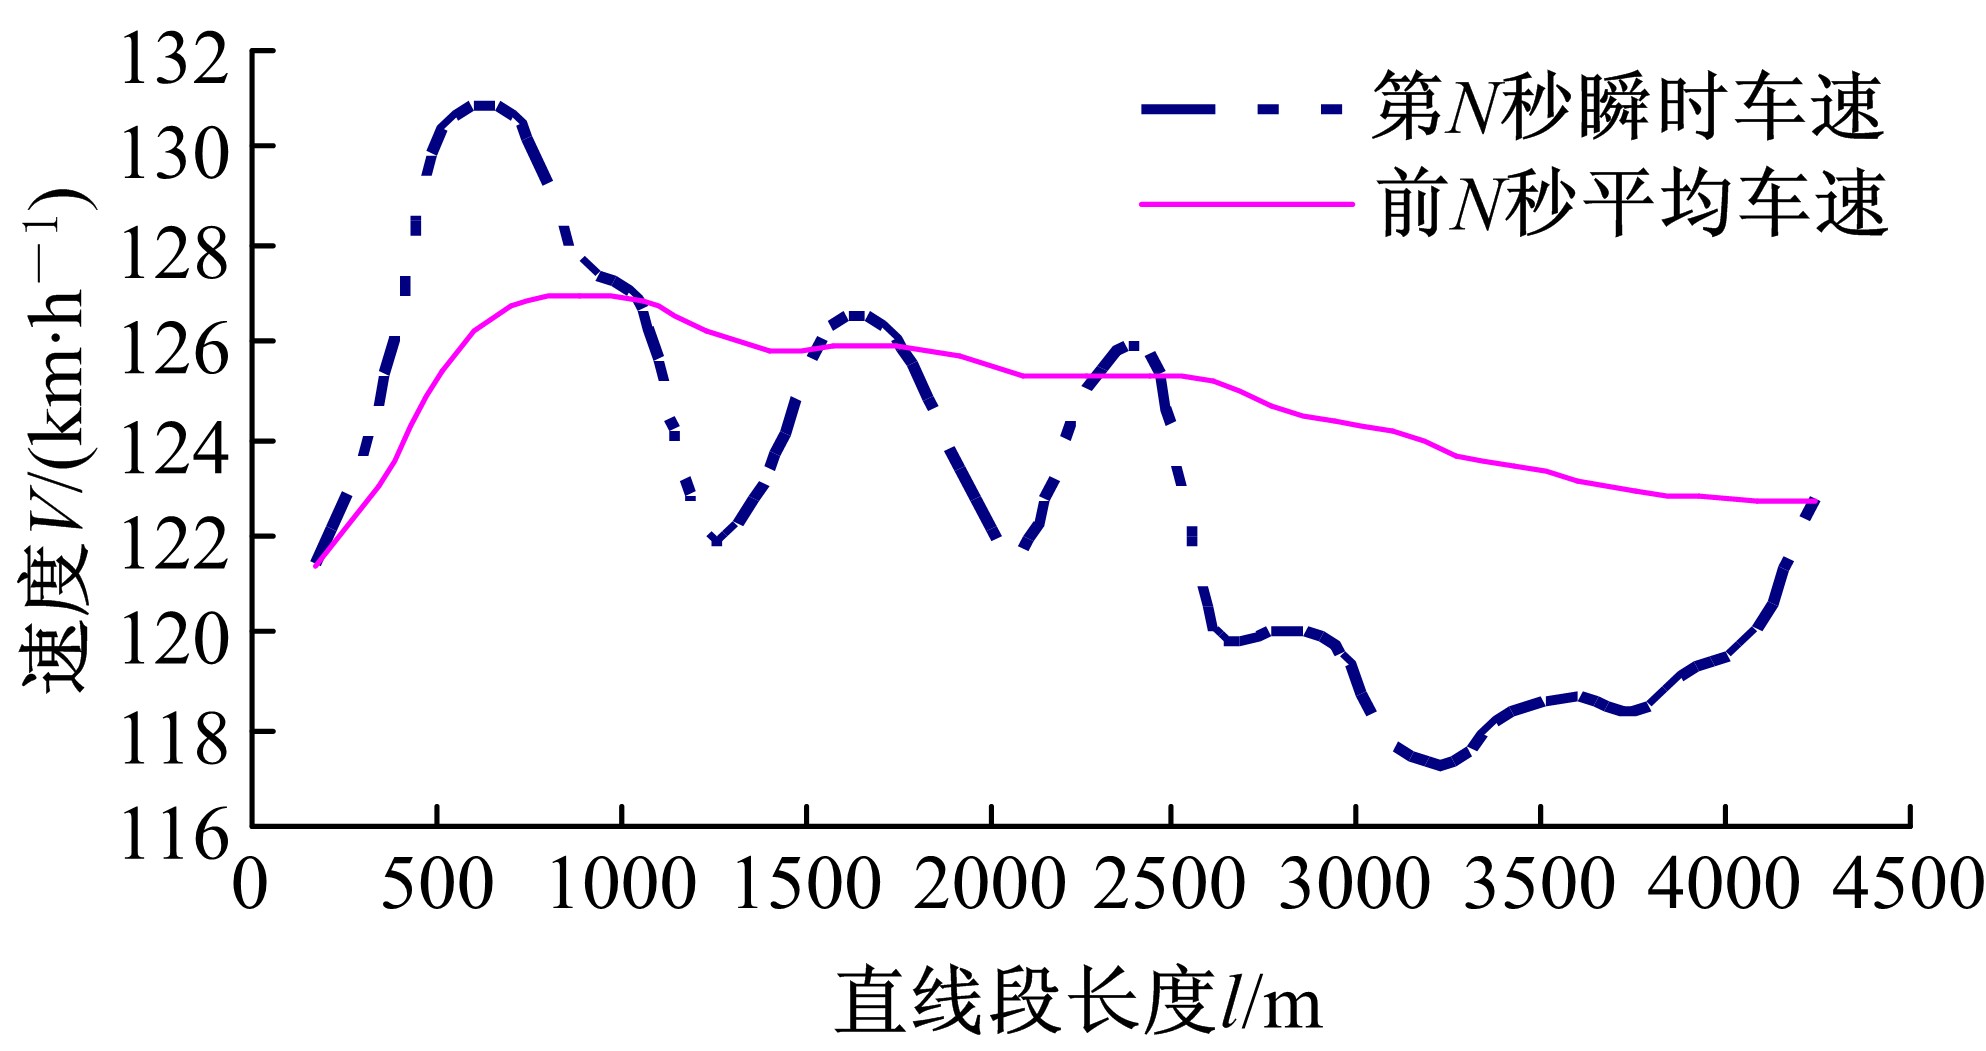
Comparison of instantaneous speed of Nth and cumulative speed before N s of line"

Fig.7

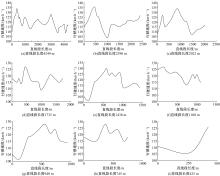
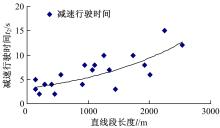
Relationship between deceleration time and line's length"

Fig.8

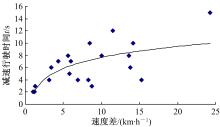
Difference of deceleration running time and speed"

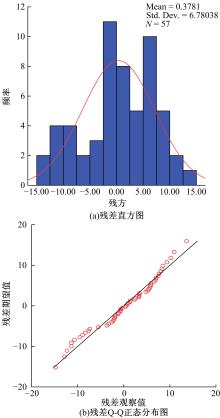
Fig.9

Model residual test diagram"

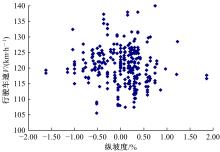
Fig.10

Relationship between running speed when lines' longitudinal slope less than 2%"

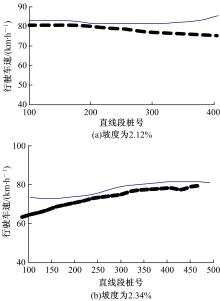
Fig.11

Speed compared in same line of uphills and downhills"

Table 3

Running speed corrected models of straight section"

纵坡坡度速度调整
上坡坡度[2%,3%]Vs=0.956V
坡度[3%,4%]降低5 km/h/1000 m,直至最低运行速度
坡度>4%降低8 km/h/1000 m,直至最低运行速度
下坡坡度[2%,3%]Vx=1.045V
坡度[3%,4%]增加10 km/h/500 m,直至期望速度
坡度>4%增加10 km/h/500 m,直至期望速度

Table 4

Comparison of test values and the model values for line segments of different lengths"

直线段长度:4247 m测试点(纵坡:0.17%~0.33%)
距离起点200 m400 m600 m800 m
测试值129132135131129
模型值124127130.3333126.3333124
Vm-Vc5.962.092.121.011.60
距离1000 m1200 m1400 m1600 m1800 m
测试值125124.3333126.3333128127.6667
模型值120119.3333121.3333123122.6667
Vm-Vc5.05.05.05.05.0
距离2000 m2200 m2400 m2600 m2800 m
测试值128128130131128
模型值129.2106128.9784128.7463128.5141128.282
Vm-Vc1.210.981.241.490.28
距离3000 m3200 m3400 m3600 m3800 m
测试值125.00124.67122.67122.33123.33
模型值128.0498127.8176127.5855127.3533127.1212
Vm-Vc3.053.154.925.023.79
距离4000 m4200 m终点
测试值123.67123.33124.33
模型值126.889126.6569125.9604
Vm-Vc3.223.321.63
直线段长度:910 m测试点(纵坡:0.17%~0.33%)
距离起点200 m400 m600 m910 m
测试值109110111.6667111111.3333
模型值103.925105.05107.1653105.49104.57
Vm-Vc5.064.954.505.516.76
直线段长度:557 m测试点(纵坡:2.43%)
距离起点100 m200 m300 m终点557
测试值6067737270
模型值67.91273.82872.9772.177670.655
Vm-Vc7.916.830.030.180.66
1 裴玉龙, 马骥. 道路交通事故道路条件成因分析及预防对策研究[J]. 中国公路学报, 2003(4): 77-82.
Pei Yu-long,Ma Ji. Research on countermeasures for road condition causes of traffic accidents[J]. China Journal of Highway and Transport, 2003(4): 77-82.
2 王芳, 李晓光, 郭慧, 等. 基于驾驶员视觉兴趣区的沙漠草原公路曲线间直线段线形指标优化[J]. 吉林大学学报: 工学版, 2020, 50(1): 114-120.
Wang Fang,Li Xiao-guang,Guo Hui,et al.Optimization of straight segment index between highway curves of desert grassland based on driver's visual interest region[J]. Journal of Jilin University (Engineering and Technology Edition), 2020, 50(1): 114-120.
4 裴玉龙, 程国柱. 高速公路车速离散性与交通事故的关系及车速管理研究[J]. 中国公路学报, 2004(1): 74-79.
Pei Yu-long, Cheng Guo-zhu. Research on the relationship between speed dispersion and traffic accidents and speed management of expressway[J]. China Journal of Highway and Transport, 2004(1): 74-79.
5 阎莹. 高速公路运行车速预测模型及其应用研究[D]. 上海: 同济大学交通运输工程学院, 2009.
Yan Ying. Research on the prediction model of Expressway speed and its application[D]. Shanghai: School of Transportation Engineering, Tongji University, 2009.
6 Fu X S. Prediction model of theoretical operating speed based on combination alignment of cross and vertical section[J]. Journal of Chang Pan University (Natural Science Edition), 2010, 30(3): 24-27.
7 . 公路项目安全评价规范[S]..
8 Misaghi P, Hassan Y. Modeling operating speed and speed differential on two-lane rural roads[J]. Journal of Transportation Engineering, 2005, 131(6): 408-417.
10 范振宇, 张剑飞. 公路运行车速测算模型的研究和标定[J]. 中国公路学报, 2002(1): 107-109.
Fan Zhen-yu, Zhang Jian-fei. Research and calibration of highway running speed measurement model[J]. China Journal of Highway and Transport, 2002(1): 107-109.
11 Wang F, Hu J. Modeling and analysis of drivers' visually interesting area[J]. Advance in Transportation Studies: An Iinternational Journal, 2018(3): 43-50.
12 白辂韬. 基于线形条件的高速公路运行速度预测及控制研究[D]. 天津: 天津大学建筑工程学院, 2013.
Bai Jian-tao. Study on prediction and control of expressway running speed based on linear conditions [D]. Tianjin: School of Civil Engineering, Tianjin University, 2013.
13 高振海, 李扬, 张慧, 等. 不同车速下驾驶员变换车道前视行为特征规律[J]. 吉林大学学报: 工学版, 2016, 46(5): 1385-1390.
Gao Zhen-hai, Li Yang, Zhang Hui, et al. Driver's forward-looking behavior analysis during lane change under different speed[J]. Journal of Jilin University (Engineering and Technology Edition), 2016, 46(5): 1385-1390.
[1] NA Jing-xin, BAI Shuang, LIU Hai-peng, YAN Ya-kun. Effects of drawbead corner radius and metal flow direction on drawbead restraining force [J]. 吉林大学学报(工学版), 2015, 45(5): 1402-1407.
[2] XU Liang,CHENG Guo-zhu. Setting minimum vehicle speed limit on freeway based on speed scattering and economic speed [J]. 吉林大学学报(工学版), 2010, 40(03): 661-0665.
[3] GUI Hai-Lin, WANG Jin-Song, WANG Yun-Peng, E Wen-Juan, GAO Lei. Vehicle fuel consumption model based on urban road operations [J]. 吉林大学学报(工学版), 2009, 39(05): 1146-1150.
[4] LI Xia,SHAO Chun-fu,CAO Peng . Economy level and freight model utilizing quick Kmeans cluster method [J]. 吉林大学学报(工学版), 2008, 38(05): 1040-1043.
Viewed
Full text


Abstract

Cited

  Shared   
  Discussed   
No Suggested Reading articles found!