吉林大学学报(工学版) ›› 2024, Vol. 54 ›› Issue (10): 2764-2770.doi: 10.13229/j.cnki.jdxbgxb.20221589

• 车辆工程·机械工程 • 上一篇    

Weibull形状参数加权极大似然估计的偏差修正

杨小玉1,2(),谢里阳1,2(),杨奕凤1,2,赵丙峰1,2,李元3   

  1. 1.东北大学 机械工程与自动化学院,沈阳 110819
    2.东北大学 航空动力装备振动及控制教育部重点实验室,沈阳 110819
    3.西北工业大学 航空学院,西安 710072
  • 收稿日期:2022-10-12 出版日期:2024-10-01 发布日期:2024-11-22
  • 通讯作者: 谢里阳 E-mail:yxy18210532358@126.com;lyxieneu@163.com
  • 作者简介:杨小玉(1993-),女,博士研究生.研究方向:可靠性工程.E-mail:yxy18210532358@126.com
  • 基金资助:
    国家科技重大专项项目(J2019-V-0009-0103);国家自然科学基金项目(52005087)

Bias correction for weighted maximum likelihood estimation of Weibull shape parameters

Xiao-yu YANG1,2(),Li-yang XIE1,2(),Yi-feng YANG1,2,Bing-feng ZHAO1,2,Yuan LI3   

  1. 1.School of Mechanical Engineering and Automation,Northeastern University,Shenyang 110819,China
    2.Key Laboratory of Vibration and Control of Aero-Propulsion Systems,Ministry of Education,Northeastern University,Shenyang 110819,China
    3.School of Aeronautics,Northwestern Polytechnical University,Xi′an 710072,China
  • Received:2022-10-12 Online:2024-10-01 Published:2024-11-22
  • Contact: Li-yang XIE E-mail:yxy18210532358@126.com;lyxieneu@163.com

摘要:

针对在小样本下加权最大似然方法(WMLE)估计形状参数存在偏差的问题,本文研究了在小样本情形下(样本量为3~15)加权极大似然估计形状参数(β>1)的偏差修正方法,提出了关于样本量的两个偏差修正函数,易于使用。通过蒙特卡洛(Monte Carlo)仿真,在不同的威布尔模型、不同小样本量下,验证了本文偏差修正方法估计的形状参数的准确性和有效性。最后通过实例分析,表明本文偏差修正方法具有可行性。

关键词: 应用统计数学, 三参数威布尔分布, 形状参数, 加权极大似然估计, 偏差修正

Abstract:

There is bias in estimating shape parameters(β>1) using the weighted maximum likelihood method(WMLE) under small samples. Hence, we study the bias correction method for weighted maximum likelihood estimation of shape parameters in the small sample case (sample sizes of 3 to 15), and two bias correction functions about the sample size are proposed, which are easy to use. By Monte Carlo simulation, the accuracy and validity of the shape parameters estimated by this bias correction method are verified under different Weibull models and different small sample sizes. The example shows that the bias correction method is feasible.

Key words: applied statistical mathematics, three-parameter Weibull distribution, shape parameter, weighted maximum likelihood estimation, bias correction

中图分类号: 

  • TB114.3

表1

不同样本量下估计的形状参数均值和偏差[W(2,1,1)]"

特征n=3n=4n=5n=6n=7n=8n=9n=10n=11n=12n=13n=14n=15
mean1.49241.66321.75161.81061.83921.85661.88081.89421.90381.91761.92081.92821.9294
bias-0.5076-0.3368-0.2484-0.1894-0.1608-0.1434-0.1192-0.1058-0.0962-0.0824-0.0792-0.0718-0.0706

表2

不同样本量下估计的形状参数均值和偏差[(W(3,1,1)]"

特征n=3n=4n=5n=6n=7n=8n=9n=10n=11n=12n=13n=14n=15
mean2.21402.47112.59292.67482.71142.75792.79092.81462.83052.84042.84642.86232.8674
bias-0.7860-0.5289-0.4071-0.3252-0.2886-0.2421-0.2091-0.1854-0.1695-0.1596-0.1536-0.1377-0.1326

表3

不同样本量下估计的形状参数均值和偏差[W(2,3,2)]"

特征n=3n=4n=5n=6n=7n=8n=9n=10n=11n=12n=13n=14n=15
mean1.48751.66431.75271.81181.84051.86421.88101.89631.90231.91581.92571.92801.9301
bias-0.5125-0.3357-0.2473-0.1882-0.1595-0.1358-0.1190-0.1037-0.0977-0.0842-0.0743-0.0720-0.0699

表4

不同样本量下估计的形状参数均值和偏差[W(3,4,5)]"

特征n=3n=4n=5n=6n=7n=8n=9n=10n=11n=12n=13n=14n=15
mean2.20332.47842.59612.67982.72482.76112.79842.81552.83332.83642.84562.86522.8638
bias-0.7967-0.5216-0.4039-0.3202-0.2752-0.2389-0.2016-0.1845-0.1667-0.1636-0.1544-0.1348-0.1362

表5

不同威布尔分布不同样本量下估计的形状参数均值与真实值的比值"

β_trueβ_mean/β_true
n=3n=4n=5n=6n=7n=8n=9n=10n=11n=12n=13n=14n=15
β=1.50.76110.85340.89690.92240.93890.94920.95430.95880.96570.96910.97150.97190.9738
β=1.80.75070.83790.87870.90930.92530.93720.94400.95080.95730.95900.96540.96690.9706
β=20.74620.83160.87580.90530.91960.92830.94040.94710.95190.95880.96040.96410.9647
β=2.50.73800.82270.86920.89470.91300.92470.93260.93920.94500.95140.95310.95860.9605
β=30.73800.82370.86430.89160.90380.91930.93030.93820.94350.94680.94880.95410.9558
β=3.50.73510.82110.85760.89070.90730.92040.92690.93380.93970.94340.95200.95360.9573
β=40.73250.82190.86090.88770.90660.91920.92950.93390.93960.94530.94930.95530.9557
β=4.50.73610.81810.86690.88970.90950.91990.92970.93500.93910.94810.94830.95530.9558
β=50.73680.82370.86360.88830.90770.91730.92540.93340.94150.94920.94980.95630.9593
β=60.73590.82690.87120.89570.90840.92320.93200.93960.94640.94970.95410.95560.9568
β=70.74340.83110.87060.89390.91030.92300.93420.93870.94410.94520.95490.95910.9655
β=80.75040.83150.87460.89930.91860.91980.92940.93320.94160.94210.95060.95400.9541
mean0.74200.82860.87090.89740.91410.92510.93410.94010.94630.95070.95490.95870.9608

表6

形状参数修正前后的估计结果[W(3,10,10),n=4]"

No.β_WMLEβ_MRβ_MH
12.09012.52152.5220
22.89823.49633.4970
32.07592.50432.5048
42.26052.72692.7275
52.97623.59043.5912
62.03792.45852.4590
72.45042.95612.9567
82.48352.99602.9966
92.09662.52932.5298
102.40772.90462.9052

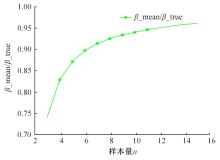
图1

β_mean/β_true与样本量的关系"

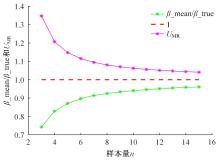
图2

UMR与β_mean/β_true关于样本量的函数"

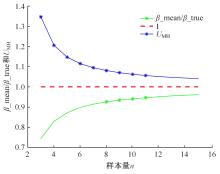
图3

UMH与β_mean/β_true关于样本量的函数"

表7

形状参数修正前后的均值、偏差和均方差根[W(3,10,10),n=4]"

特征β_WMLEβ_MRβ_MH
mean2.45692.96462.9640
bias-0.5431-0.0354-0.0360
RMSE0.59540.29670.2967

表8

形状参数修正前后的估计结果[W(4,1,2),n=5]"

No.β_WMLEβ_MRβ_MH
13.10423.56293.5624
23.18743.65843.6578
34.01664.61024.6095
43.98464.57354.5728
52.93083.36393.3634
63.09273.54983.5492
73.29423.78113.7805
83.58574.11564.1150
93.55554.08104.0803
103.58974.12024.1195

表9

形状参数修正前后的均值、偏差和均方差根[W(4,1,2),n=5]"

特征β_WMLEβ_MRβ_MH
mean3.44433.95273.9533
bias-0.5557-0.0473-0.0467
RMSE0.62110.32180.3218

表10

形状参数修正前后的估计结果(实例)"

形状参数数值
β_WMLE1.8296
β_MR1.9441
β_MH1.9440
1 陈传海, 王成功, 杨兆军,等. 数控机床可靠性建模研究现状及发展动态分析[J]. 吉林大学学报:工学版, 2022, 52(2): 253-266.
Chen Chuan-hai, Wang Cheng-gong, Yang Zhao-jun. Research status and development trend analysis of reliability modeling of CNC machine tools[J]. Journal of Jilin University(Engineering and Technology Edition),2022, 52(2): 253-266.
2 龙哲, 申桂香, 王晓峰,等. 竞争失效的刀具可靠性评估模型[J]. 吉林大学学报:工学版, 2019, 49(1):141-148.
Long Zhe, Shen Gui-xiang, Wang Xiao-feng, et al. Reliability evaluation model of tool on competitive failure[J]. Journal of Jilin University (Engineering and Technology Edition), 2019, 49(1):141-148.
3 Abernethy R B. The new Weibull handbook[Z].
4 Charles E E. An Introduction to Reliability and Maintainability Engineering[M]. Illinois: Waveland Press Inc, 2005.
5 赵敏, 张万生, 徐立生. 用于求取LED平均寿命的威布尔图估法[C]∥第十二届全国LED产业研讨与学术会议,深圳,2010: 219-222.
6 Chen D, Chen Z. Statistical inference about the location parameter of the three-parameter Weibull distribution[J]. Journal of Statistical Computation and Simulation, 2009, 79(3): 215-225.
7 王嘉琦, 徐岩, 彭雅楠,等. 基于灰色-三参数威布尔分布模型的继电保护装置可靠性参数估计[J]. 电网技术, 2019, 43(4):1354-1360.
Wang Jia-qi, Xu Yan, Peng Ya-nan, et al. Estimation of reliability parameters of protective relays based on grey-three-parameter Weibull distribution model[J]. Power System Technology, 2019, 43(4):1354-1360.
8 Teimouri M, Hoseini S M, Nadarajah S. Comparison of estimation methods for the Weibull distribution[J]. Statistics, 2013,47(1): 93-109.
9 陈腾飞. 小样本下的机械产品可靠性评估方法及其在冲压空气涡轮中的应用[D].长沙:国防科技大学电子科学学院,2017.
Chen Teng-fei. Reliability evaluation method of mechanical products under small samples and its application in ram air turbine[D]. Changsha: School of Electronic Science,National University of Defense Technology, 2017.
10 Cousineau D. Nearly unbiased estimators for the three-parameter Weibull distribution with greater efficiency than the iterative likelihood method[J]. British Journal of Mathematical and Statistical Psychology, 2009, 62:167-191.
11 Jiang R Y. Influence factors and range of the Weibull shape parameter[C]∥The 7th International Conference on "Mathematical Methods in Reliability"- Theory, Methods, Applications,Beijing,China,2011: 238-244.
12 Ross R. Formulas to describe the bias and standard deviation of the ML estimated Weibull shape parameter[J]. IEEE Transactions Dielectrics and Electrical Insulation,1994,1(2):247-253.
13 Hirose H. Bias correction for the maximum likelihood estimates in the two parameter Weibull distribution[J]. IEEE Transactions Dielectrics and Electrical Insulation 1999,6(1):66-68.
14 罗哉, 王岚晶, 唐颖奇,等. 基于三参数威布尔分布的自动调整臂疲劳寿命的P-S-N曲线研究[J]. 计量学报, 2018, 39(2):187-191.
Luo Zai, Wang Lan-Jing, Tang Ying-qi, et al. Research on the P-S-N curve of fatigue life of automatic brake adjuster based on three parameter Weibull distribution[J]. Acta Metrologica Sinica, 2018, 39(2):187-191.
[1] 任露泉, 王德辉, 田喜梅, 李建桥. 蚯蚓体表轮廓曲线谱分析及统计模型[J]. 吉林大学学报(工学版), 2009, 39(04): 988-992.
[2] 张英芝,申桂香,吴甦,薛玉霞,何宇 . 随机截尾数控机床三参数威布尔分布模型[J]. 吉林大学学报(工学版), 2009, 39(02): 378-0381.
[3] 车翔玖,刘大有,王钲旋 .

两张NURBS曲面间G1光滑过渡曲面的构造

[J]. 吉林大学学报(工学版), 2007, 37(04): 838-841.
Viewed
Full text


Abstract

Cited

  Shared   
  Discussed   
No Suggested Reading articles found!