Journal of Jilin University(Medicine Edition) ›› 2026, Vol. 52 ›› Issue (2): 513-522.doi: 10.13481/j.1671-587X.20260224
• Research in clinical medicine • Previous Articles
Relationship between glucose coefficient of variation and hyperuricemia in early-onset type 2 diabetes mellitus
Yuanshuang JIANG,Yang YU,Ruopu LI,Qinyan HUANG,Yunwei SUN,Yan CHEN( )
)
- Department of Endocrinology,Second Hospital,Jilin University,Changchun 130041,China
-
Received:2025-06-01Accepted:2025-08-04Online:2026-03-28Published:2026-04-15 -
Contact:Yan CHEN E-mail:cheny99@jlu.edu.cn
CLC Number:
- R587.1
Cite this article
Yuanshuang JIANG,Yang YU,Ruopu LI,Qinyan HUANG,Yunwei SUN,Yan CHEN. Relationship between glucose coefficient of variation and hyperuricemia in early-onset type 2 diabetes mellitus[J].Journal of Jilin University(Medicine Edition), 2026, 52(2): 513-522.
share this article
Tab. 1
Baseline characteristics of patients in late-onset T2DM group and early-onset T2DM group"
| Variable | Late-onset T2DM(n=121) | Early-onset T2DM(n=103) | t/χ2/Z | P |
|---|---|---|---|---|
| Age [M(P25, P75), year] | 57.00(51.00,66.00) | 44.50(36.00,58.00) | -12.90 | <0.001 |
| Disease duration [M(P25, P75), year] | 9.00(4.00,15.00) | 4.00(1.00,10.00) | -8.81 | <0.001 |
| Gender [n(%)] | 10.70 | <0.001 | ||
| Male | 76(62.8) | 85(82.5) | ||
| Female | 45(37.2) | 18(17.5) | ||
| Smoking [n(%)] | 0.30 | 0.587 | ||
| Yes | 37(30.6) | 35(34.0) | ||
| No | 84(69.4) | 68(66.0) | ||
| Drinking [n(%)] | 1.68 | 0.195 | ||
| Yes | 35(28.9) | 22(21.4) | ||
| No | 86(71.1) | 81(78.6) | ||
| Family history of diabetes [n(%)] | 5.73 | 0.017 | ||
| Yes | 25(20.7) | 36(35.0) | ||
| No | 96(79.3) | 67(65.0) | ||
| BMI (x±s, kg·m-2) | 26.30±5.26 | 28.85±4.11 | 3.99 | <0.001 |
| SUA (x±s, μmol·L-1) | 349.35±103.71 | 442.64±100.19 | 6.82 | <0.001 |
| ALT [M(P25, P75), U·L-1] | 21.00(15.00,30.00) | 43.00(25.00,72.00) | -6.65 | <0.001 |
| AST [M(P25, P75), U·L-1] | 20.00 (16.00,25.25) | 24.00(18.00,37.00) | -3.47 | <0.001 |
| Scr [M(P25, P75), μmol·L-1] | 65.00(55.00,76.00) | 68.50(60.00,80.50) | -1.67 | 0.094 |
| BUN [M(P25, P75), mmol·L-1] | 6.05(5.22,7.04) | 5.24(4.34,6.21) | -3.99 | <0.001 |
| GFR [M(P25, P75), mL·min-1] | 98.50(88.45,108.40) | 117.40(105.70,123.00) | -7.42 | <0.001 |
| TC [M(P25, P75), mmol·L-1] | 4.96(4.39,5.72) | 5.26(4.55,6.34) | -1.89 | 0.058 |
| TG [M(P25, P75), mmol·L-1] | 2.14(1.35,3.38) | 3.46(2.01,6.07) | -4.33 | <0.001 |
| HDL-C (x±s,mmol·L-1) | 1.15±0.27 | 1.03±0.23 | -3.37 | <0.001 |
| LDL-C [M(P25, P75),mmol·L-1] | 2.93(2.31,3.49) | 2.98(2.53,3.61) | -1.54 | 0.125 |
| AI [M(P25, P75)] | 3.36(2.45,4.56) | 4.23(3.37,5.21) | -4.08 | <0.001 |
| HbA1c [M(P25, P75), %] | 7.60 (6.30,8.90) | 8.80(7.45,10.45) | -4.11 | <0.001 |
| FPG [M(P25, P75), mmol·L-1] | 8.10 (6.53,10.30) | 9.85(7.69,12.32) | -2.91 | 0.004 |
| FINS [M(P25, P75), mIU·L-1] | 12.98(7.63,19.70) | 11.57(8.42,19.39) | -0.27 | 0.790 |
| FC-P [M(P25, P75), nmol·L-1] | 1.57(1.10,2.06) | 2.44(1.76,3.35) | -6.01 | <0.001 |
| 2hPG [M(P25, P75), mmol·L-1] | 11.90(10.10,15.10) | 12.20(9.60,15.80) | -0.08 | 0.934 |
| 2h-INS [M(P25, P75), mIU·L-1] | 42.36(27.52,59.22) | 34.94(25.66,52.05) | -1.52 | 0.129 |
| 2hC-P [M(P25, P75), nmol·L?1] | 4.19(2.42,5.70) | 4.79(2.99,6.10) | -1.16 | 0.247 |
| HOMA-IR [M(P25, P75)] | 4.73(2.81,8.16) | 5.21(3.38,8.37) | -0.79 | 0.431 |
| GCV (x±s,%) | 18.87±2.66 | 20.57±5.07 | 3.08 | 0.003 |
| MBG (x±s, mmol·L-1) | 9.13±2.19 | 8.77±1.86 | -1.32 | 0.188 |
| SDBG (x±s, mmol·L-1) | 1.91±1.06 | 2.07±0.69 | 1.39 | 0.167 |
| MAGE (x±s, mmol·L-1) | 3.72±0.96 | 3.88±1.12 | 1.09 | 0.276 |
| GMI (x±s, %) | 7.24±0.94 | 7.08±0.80 | -1.32 | 0.189 |
| TIR [M(P25, P75), %] | 79.00(50.00,93.00) | 78.00(57.00,94.00) | -0.36 | 0.720 |
| GRI [M(P25, P75), %] | 17.60(5.60,40.60) | 20.00(5.60,42.00) | -0.09 | 0.931 |
| HUA [n(%)] | 18(14.88) | 65(63.11) | 55.49 | <0.001 |
Tab.2
Baseline characteristics of early-onset T2DM patients in non-HUA group and HUA group"
| Variable | Non-HUA (n=38) | HUA (n=65) | t/Z | P |
|---|---|---|---|---|
| Age [M(P25, P75), year] | 35.50(31.25,38.75) | 35.00(30.00,38.00) | -0.71 | 0.476 |
| Disease duration [M(P25, P75), year] | 1.00(1.00,2.00) | 1.00(1.00,4.25) | -1.20 | 0.229 |
| BMI (x±s, kg·m?2) | 27.99±3.78 | 29.35±4.24 | -1.63 | 0.106 |
| ALT [M(P25, P75), U·L?1] | 35.00(20.00,63.00) | 43.50 (28.00, 74.25) | -1.36 | 0.174 |
| AST [M(P25, P75), U·L?1] | 21.50(16.25,36.50) | 25.00(20.00,37.00) | -1.55 | 0.121 |
| Scr [M(P25, P75), μmol·L?1] | 62.50(55.50,70.75) | 72.50(64.00,86.00) | -3.25 | 0.001 |
| BUN [M(P25, P75), mmol·L?1] | 5.85(4.51,6.37) | 5.14(4.30, 6.11) | -1.12 | 0.261 |
| TC [M(P25, P75), mmol·L?1] | 4.87(4.45,6.24) | 5.32(4.57,6.40) | -0.47 | 0.642 |
| TG [M(P25, P75), mmol·L?1] | 2.91(2.04,4.17) | 4.28(1.85,6.62) | -2.00 | 0.046 |
| HDL-C (x±s, mmol·L?1) | 1.10±0.27 | 0.99±0.20 | 2.22 | 0.028 |
| LDL-C [M(P25, P75), mmol·L?1] | 2.99(2.53,3.58) | 2.96(2.53,3.61) | -0.16 | 0.876 |
| AI [M(P25, P75)] | 3.72(3.29,4.89) | 4.40(3.58,5.50) | -2.20 | 0.028 |
| HbA1c [M(P25, P75), %] | 8.25(7.05,9.90) | 9.50(7.57,10.83) | -1.34 | 0.180 |
| FPG [M(P25, P75), mmol·L?1] | 9.85(7.91,12.82) | 9.85(7.42,11.82) | -0.49 | 0.626 |
| FINS [M(P25, P75), mIU·L?1] | 9.72(8.10,14.40) | 12.95(8.65,19.79) | -1.14 | 0.252 |
| FC-P [M(P25, P75), nmol·L?1] | 1.96(1.49,2.46) | 2.70(2.10,3.52) | -2.85 | 0.004 |
| 2hPG [M(P25, P75), mmol·L?1] | 13.55(10.20,17.78) | 11.80(9.60,15.50) | -1.03 | 0.301 |
| 2h-INS [M(P25, P75), mIU·L?1] | 33.72(25.00,51.72) | 35.69(25.97,51.63) | -0.40 | 0.690 |
| 2hC-P (x±s, nmol·L?1) | 3.60±1.81 | 5.48±2.63 | -3.73 | <0.001 |
| HOMA-IR [M(P25, P75)] | 4.33(3.34,7.85) | 5.60(3.47,8.51) | -0.95 | 0.341 |
| GCV (x±s, %) | 17.43±3.01 | 22.41±5.14 | -6.21 | <0.001 |
| TIR [M(P25, P75), %] | 72.00(45.00,94.00) | 80.00(66.00,93.00) | -0.89 | 0.374 |
| MBG [M(P25, P75), mmol·L?1] | 8.95(7.05,10.65) | 8.40(7.20,9.50) | -1.03 | 0.303 |
| MAGE [M(P25, P75), mmol·L?1] | 3.40(2.80,4.00) | 3.90(3.30,4.50) | -2.37 | 0.018 |
| GMI [M(P25, P75), %] | 7.17(6.34,7.90) | 6.93(6.41,7.40) | -1.03 | 0.303 |
| GRI [M(P25, P75), %] | 25.20(4.80,50.60) | 18.40(5.60,30.40) | -0.66 | 0.509 |
Tab.3
Baseline characteristics of early-onset T2DM patients in various groups based on GCV quartiles"
| Variable | Q1 group (n=25) | Q2 group (n=26) | Q3 group (n=26) | Q4 group (n=26) | χ2/F | P |
|---|---|---|---|---|---|---|
| BMI [M(P25, P75), kg·m-2] | 29.30(26.30,31.22) | 28.20(26.03,30.47) | 27.77(26.76,29.93) | 29.16(24.85,31.42) | 0.47 | 0.926 |
| ALT [M(P25, P75), U·L?1] | 53.00(20.00,73.00) | 35.00(24.00,50.00) | 39.00(28.00,75.00) | 43.50(29.25,91.25) | 2.80 | 0.423 |
| AST [M(P25, P75), U·L?1] | 32.00(18.00,39.00) | 21.50(17.25,31.50) | 23.50(20.00,38.75) | 28.50(19.25,37.00) | 2.87 | 0.413 |
| Scr [M(P25, P75), μmol·L?1] | 68.00(60.00,78.00) | 64.00(57.00,78.75) | 76.00(66.00,82.00) | 66.00(60.00,84.25) | 5.00 | 0.172 |
| BUN [M(P25, P75), mmol·L?1] | 5.20(4.39,6.09) | 5.93(4.33,6.26) | 5.02(4.28,5.58) | 5.22(4.42,6.19) | 0.81 | 0.847 |
| SUA [M(P25, P75),μmol·L?1] | 411.00(330.00,484.00) | 366.50(310.25,415.75) | 464.50(438.50,515.25) | 496.00(453.50,520.25) | 25.41 | <0.001 |
| TC [M(P25, P75), mmol·L?1] | 5.16(4.46,6.41) | 5.68(4.35,6.59) | 4.97(4.71,5.92) | 5.17(4.78,6.31) | 0.27 | 0.966 |
| TG [M(P25, P75), mmol·L?1] | 2.63(1.52,5.73) | 2.63(2.15,4.48) | 3.96(1.84,6.92) | 5.08(3.46,6.36) | 5.32 | 0.150 |
| HDL-C (x±s, mmol·L?1) | 1.11±0.25 | 1.04±0.26 | 0.97±0.22 | 1.01±0.19 | 1.51 | 0.218 |
| LDL-C [M(P25, P75), mmol·L?1] | 2.99(2.62,3.37) | 3.37(2.59,3.84) | 2.98(2.54,3.61) | 2.72(2.39,3.43) | 2.75 | 0.431 |
| AI [M(P25, P75)] | 3.45(3.16,5.20) | 4.20(3.46,5.17) | 4.35(3.59,5.59) | 4.24(3.89,5.21) | 2.14 | 0.544 |
| FPG (x±s, mmol·L?1) | 10.53±3.15 | 10.59±3.11 | 9.55±3.11 | 9.91±3.18 | 0.58 | 0.631 |
| HbA1c [M(P25, P75), %] | 7.80(6.95,10.02) | 8.70(7.67,10.83) | 8.30(6.80,10.65) | 9.60(8.70,10.50) | 4.36 | 0.225 |
| HOMA-IR [M(P25, P75)] | 4.99(3.67,8.40) | 4.97(3.24,6.66) | 4.93(3.41,7.79) | 6.93(3.59,9.97) | 2.22 | 0.527 |
Tab.4
Associations between SUA levels and CGM-related indexes and HbA1c level in early-onset T2DM patients"
| Variable | ρ | Raw P value | FDR-adjusted P value |
|---|---|---|---|
| GCV | 0.403 | <0.001 | 0.008 |
| HbA1c | 0.219 | 0.036 | 0.144 |
| MBG | -0.063 | 0.525 | 0.588 |
| SDBG | 0.072 | 0.470 | 0.588 |
| MAGE | 0.114 | 0.251 | 0.502 |
| GMI | -0.063 | 0.525 | 0.588 |
| TIR | 0.075 | 0.454 | 0.588 |
| GRI | -0.054 | 0.588 | 0.588 |
Tab.5
Associations between GCV and HUA in early-onset T2DM patients"
| Group | n | Model 1 | Model 2 | Model 3 | |||
|---|---|---|---|---|---|---|---|
| RR (95%CI) | P | RR (95%CI) | P | RR (95%CI) | P | ||
| GCV | |||||||
| Q1 | 25 | 1.00 | 1.00 | 1.00 | |||
| Q2 | 26 | 0.51 (0.23-1.15) | 0.107 | 0.49 (0.22-1.10) | 0.088 | 0.67 (0.29-1.54) | 0.347 |
| Q3 | 26 | 1.89 (1.24-2.89) | 0.003 | 1.81 (1.19-2.76) | 0.005 | 1.92 (1.14-3.24) | 0.014 |
| Q4 | 26 | 2.06 (1.37-3.10) | <0.001 | 2.07 (1.40-3.07) | <0.001 | 2.12 (1.28-3.51) | 0.003 |
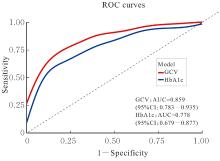
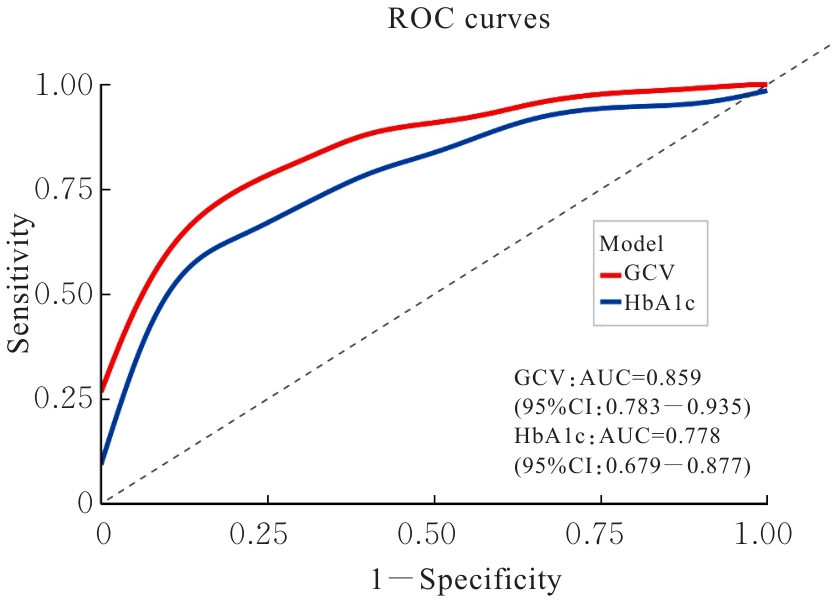
Fig. 1
ROC curves of GCV and HbA1c for prediction of early-onset T2DM with HUA"
| [1] | 李延兵. 2024年美国糖尿病学会《糖尿病诊疗标准》解读: 糖尿病诊断和分型[J]. 诊断学理论与实践, 2024, 23(5): 467-473. |
| [2] | 杨 帆, 练凤江. 2型糖尿病并发高尿酸血症相关因素分析[J]. 广东医学, 2012, 33(9): 1270-1271. |
| [3] | LI C G, HSIEH M C, CHANG S J. Metabolic syndrome, diabetes, and hyperuricemia[J]. Curr Opin Rheumatol, 2013, 25(2): 210-216. |
| [4] | DONKENG M, KUATÉ D, KOUDJOU P N, et al. Association between hyperuricemia and glycated hemoglobin in type 2 diabetes at the District Hospital of Dschang[J]. Pan Afr Med J, 2021, 40: 177. |
| [5] | MO Y F, MA X J, LU J Y, et al. Defining the target value of the coefficient of variation by continuous glucose monitoring in Chinese people with diabetes[J]. J Diabetes Investig, 2021, 12(6): 1025-1034. |
| [6] | 熊圣喜, 张然然,胡红艳,等. 2型糖尿病患者葡萄糖目标范围内时间与高尿酸血症的相关性研究[J]. 中华内分泌代谢杂志, 2023,39(7):565-570. |
| [7] | 中华医学会糖尿病学分会. 中国2型糖尿病防治指南(2020年版)(上)[J]. 中国实用内科杂志, 2021, 41(8): 668-695. |
| [8] | TAHAPARY D L, PRATISTHITA L B, FITRI N A, et al. Challenges in the diagnosis of insulin resistance: Focusing on the role of HOMA-IR and Tryglyceride/glucose index[J]. Diabetes Metab Syndr, 2022, 16(8): 102581. |
| [9] | BATTELINO T, DANNE T, BERGENSTAL R M, et al. Clinical targets for continuous glucose monitoring data interpretation: recommendations from the international consensus on time in range[J]. Diabetes Care, 2019, 42(8): 1593-1603. |
| [10] | BERGENSTAL R M, BECK R W, CLOSE K L, et al. Glucose management indicator (GMI): a new term for estimating A1C from continuous glucose monitoring[J]. Diabetes Care, 2018, 41(11): 2275-2280. |
| [11] | PÉREZ-LÓPEZ P, FÉRNANDEZ-VELASCO P, BAHILLO-CURIESES P, et al. Impact of glucose variability on the assessment of the glycemia risk index (GRI) and classic glycemic metrics[J]. Endocrine, 2023, 82(3): 560-568. |
| [12] | 中国民族卫生协会重症代谢疾病分会, 高尿酸血症相关疾病诊疗多学科共识专家组. 中国高尿酸血症相关疾病诊疗多学科专家共识(2023年版)[J]. 中国实用内科杂志, 2023, 43(6): 461-480. |
| [13] | SOHEILIPOUR F, ABBASI KASBI N, IMANKHAN M, et al. Complications and treatment of early-onset type 2 diabetes[J]. Int J Endocrinol Metab, 2023, 21(3): e135004. |
| [14] | WANG M Q, HE Y F, HE Q, et al. Comparison of clinical characteristics and disease burden between early- and late-onset type 2 diabetes patients: a population-based cohort study[J]. BMC Public Health, 2023, 23(1): 2411. |
| [15] | YADAV D, LEE E S, KIM H M, et al. Hyperuricemia as a potential determinant of metabolic syndrome[J]. J Lifestyle Med, 2013, 3(2): 98-106. |
| [16] | BAEK H S, PARK J Y, YU J, et al. Characteristics of glycemic control and long-term complications in patients with young-onset type 2 diabetes[J]. Endocrinol Metab, 2022, 37(4): 641-651. |
| [17] | GUNGOR N, BACHA F, SAAD R, et al. Youth type 2 diabetes: insulin resistance, beta-cell failure, or both?[J]. Diabetes Care, 2005, 28(3): 638-644. |
| [18] | YEUNG R O, ZHANG Y Y, LUK A, et al. Metabolic profiles and treatment gaps in young-onset type 2 diabetes in Asia (the JADE programme): a cross-sectional study of a prospective cohort[J]. Lancet Diabetes Endocrinol, 2014, 2(12): 935-943. |
| [19] | KO G J, RHEE C M, KALANTAR-ZADEH K, et al. The effects of high-protein diets on kidney health and longevity[J]. J Am Soc Nephrol, 2020, 31(8): 1667-1679. |
| [20] | SUN L, LI Z M, HU C Y, et al. Age-dependent changes in the gut microbiota and serum metabolome correlate with renal function and human aging[J]. Aging Cell, 2023, 22(12): e14028. |
| [21] | HAINES R W, ZOLFAGHARI P, WAN Y Z, et al. Elevated urea-to-creatinine ratio provides a biochemical signature of muscle catabolism and persistent critical illness after major trauma[J]. Intensive Care Med, 2019, 45(12): 1718-1731. |
| [22] | MARTINEZ M, SANTAMARINA J, PAVESI A, et al. Glycemic variability and cardiovascular disease in patients with type 2 diabetes[J]. BMJ Open Diabetes Res Care, 2021, 9(1): e002032. |
| [23] | PSOMA O, MAKRIS M, TSELEPIS A, et al. Short-term glycemic variability and its association with macrovascular and microvascular complications in patients with diabetes[J]. J Diabetes Sci Technol, 2024, 18(4): 956-967. |
| [24] | MU Z P, WANG J, WANG W, et al. Blood glucose fluctuations detected by continuous glucose monitoring system in gout patients with normal glucose tolerance and the effect of urate-lowering therapy[J]. Int J Rheum Dis, 2020, 23(9): 1145-1151. |
| [25] | RODBARD D. Glucose time in range, time above range, and time below range depend on mean or Median glucose or HbA1c, glucose coefficient of variation, and shape of the glucose distribution[J]. Diabetes Technol Ther, 2020, 22(7): 492-500. |
| [26] | LIN C C, LI C I, YANG S Y, et al. Variation of fasting plasma glucose: a predictor of mortality in patients with type 2 diabetes[J]. Am J Med, 2012, 125(4): 416.e9-416.e18. |
| [27] | WEN X, YANG H J, YANG M, et al. Factors that determine glucose variability, defined by the coefficient of variation in continuous glucose monitoring values, in a Chinese population with type 2 diabetes[J]. Diabetes Obes Metab, 2024, 26(2): 611-621. |
| [28] | MARTÍNEZ-SÁNCHEZ F D, VARGAS-ABONCE V P, GUERRERO-CASTILLO A P, et al. Serum Uric Acid concentration is associated with insulin resistance and impaired insulin secretion in adults at risk for Type 2 Diabetes[J]. Prim Care Diabetes, 2021, 15(2): 293-299. |
| [29] | MISRA S, KE C, SRINIVASAN S, et al. Current insights and emerging trends in early-onset type 2 diabetes[J]. Lancet Diabetes Endocrinol, 2023, 11(10): 768-782. |
| [30] | ZHU Y Y, PANDYA B J, CHOI H K. Prevalence of gout and hyperuricemia in the US general population: the National Health and Nutrition Examination Survey 2007-2008[J]. Arthritis Rheum, 2011, 63(10): 3136-3141. |
| [31] | SUN J, SUN M Y, SU Y K, et al. Mediation effect of obesity on the association between triglyceride-glucose index and hyperuricemia in Chinese hypertension adults[J]. J Clin Hypertens, 2022, 24(1): 47-57. |
| [32] | ASMA SAKALLI A, KÜÇÜKERDEM H S, AYGÜN O. What is the relationship between serum uric acid level and insulin resistance?: A case-control study[J]. Medicine, 2023, 102(52): e36732. |
| [33] | GOU R Y, DOU D N, TIAN M, et al. Association between triglyceride glucose index and hyperuricemia: a new evidence from China and the United States[J]. Front Endocrinol, 2024, 15: 1403858. |
| [1] | Li LIU,Linsheng HUANG,Yongheng ZHAO,Wenjie CAO,Yongshuai QIAN,Huifan YU,Fei LI. Network pharmacological analysis on Balanophora involucrataHook.f. in treatment of hyperuricemia and its therapeutic effect on hyperuricemia cell model and hyperuricemia model mouse [J]. Journal of Jilin University(Medicine Edition), 2024, 50(1): 58-70. |
| [2] | Xinghua WANG,Hongjuan YANG,Xiuhong HU,Hongrei CUI,Baozhen XU,Danlu LI,Tao WANG,Yuwei GAO. Effects of N-acetyl-L-cysteine on oxidative stress and vascular endothelial function in rats with hyperuricemia and their mechanisms [J]. Journal of Jilin University(Medicine Edition), 2021, 47(5): 1209-1214. |
| [3] | YOU Yang, XIA Yue, QI Guoqing, GAO Hongyang, YANG Zhiyu, LI Liu, ZHAO Hongliang. Effects of febuxostat on serum uric acid level and expression level of NLRP3 protein in kidney tissue in hyperuricemia model rats [J]. Journal of Jilin University(Medicine Edition), 2019, 45(06): 1367-1372. |
| [4] | LAN Yonghong, RAO Langyu, YANG Zhi, HUANG Mingmei, NIU Haiyan, QI Yaling. Expressions of HIF-1α and HSP70 in placenta tissue of patients withpregnancy-induced hypertension syndrome and their significances [J]. Journal of Jilin University Medicine Edition, 2018, 44(02): 346-349. |
| [5] | DAI Huining, LYU Shuai, WANG Deli, LI Dan, ZHANG Shitao, LIU Jianing, LIU Yang, LIU Xiaobo, LI Wannan. Therapeutic effect of sunflower powder active ingredients on hyperuricemia in mice [J]. Journal of Jilin University Medicine Edition, 2018, 44(02): 327-331. |
| [6] | FAN Hairui, ZHAO Yan, FU Jinglong, ZHANG Haibo, WANG Dechao, GAO Yugang, ZHANG Lianxue. Improvement effects of Tongfengning Capsule on hyperuricemia and renal function in mice [J]. Journal of Jilin University Medicine Edition, 2017, 43(05): 893-896. |
| [7] | TENG Rong, YANG Luyi, XIA Xiaoxue, WANG Shoudong, NING Lei, MU Qili. Analysis on correlation of sagittal craniofacial structures with different classes of malocclusion based on genetic algorithms method [J]. Journal of Jilin University Medicine Edition, 2017, 43(04): 800-804. |
| [8] | WANG Yuejuan, GAO Lichao, FANG Fang, CUI Weiwei, LIU Ya, GUO Hui. Comparison of progression between diabetic patients with different levels of uric acid and analysis on influencing factors [J]. Journal of Jilin University Medicine Edition, 2015, 41(01): 135-139. |
| [9] | YANG Si-jia,CHEN Yang,XU Shan-shan,PAN Yang,YAO Yu-hang,YANG Xue-ling,LI Bo. Detection of Ca,Fe,Zn and Cu contents in hair of 675 primary and secondary school students and its significance [J]. Journal of Jilin University Medicine Edition, 2013, 39(2): 391-395. |
|
||

