吉林大学学报(医学版) ›› 2025, Vol. 51 ›› Issue (3): 576-589.doi: 10.13481/j.1671-587X.20250303

• 基础研究 • 上一篇    

虫草素对RSL3诱导肝癌HepG2细胞铁死亡的增强作用及其机制

林涵1,杨秋燕1,钟洁月1,陈博伦1,童汪霞2()   

  1. 1.广西中医药大学研究生院,广西 南宁 530001
    2.广西中医药大学附属瑞康医院肝内科,广西 南宁 530004
  • 收稿日期:2024-07-24 接受日期:2024-09-17 出版日期:2025-05-28 发布日期:2025-07-18
  • 通讯作者: 童汪霞 E-mail:twx_01@126.com
  • 作者简介:林 涵(1997-),男,山东省威海市人,在读硕士研究生,主要从事中西医结合防治肝脏肿瘤方面的研究。
  • 基金资助:
    国家自然科学基金项目(82060843);国家自然科学基金项目(82260860);广西壮族自治区科技厅青年科学基金项目(2018GXNSFBA281189)

Improvement effect of cordycepin on ferroptosis in HepG2 cells induced by RSL3 and its mechanism

Han LIN1,Qiuyan YANG1,Jieyue ZHONG1,Bolun CHEN1,Wangxia TONG2()   

  1. 1.Graduate School,Guangxi University of Chinese Medicine,Guangxi 530001,China
    2.Department of Medical Hepatology,Affiliated Ruikang Hospital,Guangxi University of Chinese Medicine,Nanning 530004,China
  • Received:2024-07-24 Accepted:2024-09-17 Online:2025-05-28 Published:2025-07-18
  • Contact: Wangxia TONG E-mail:twx_01@126.com

摘要:

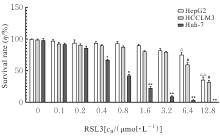
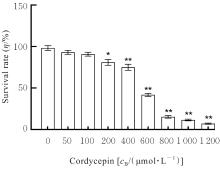
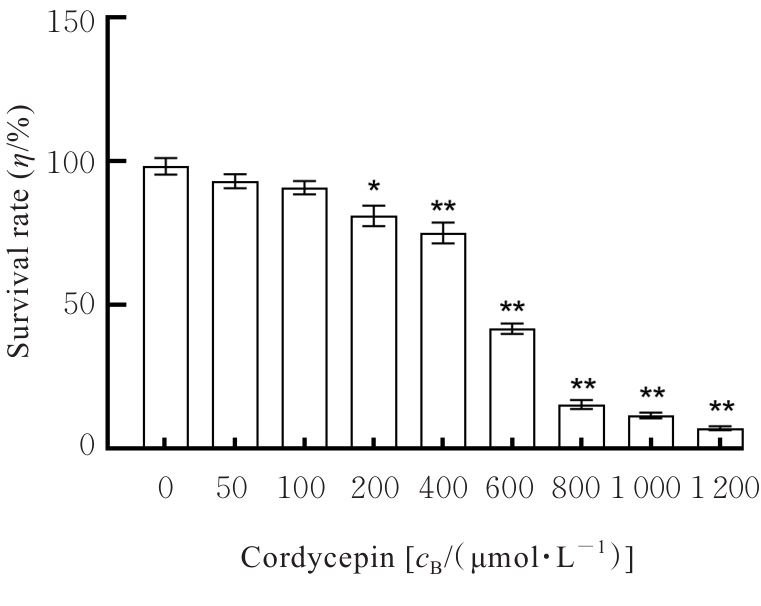
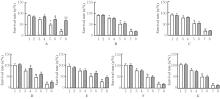
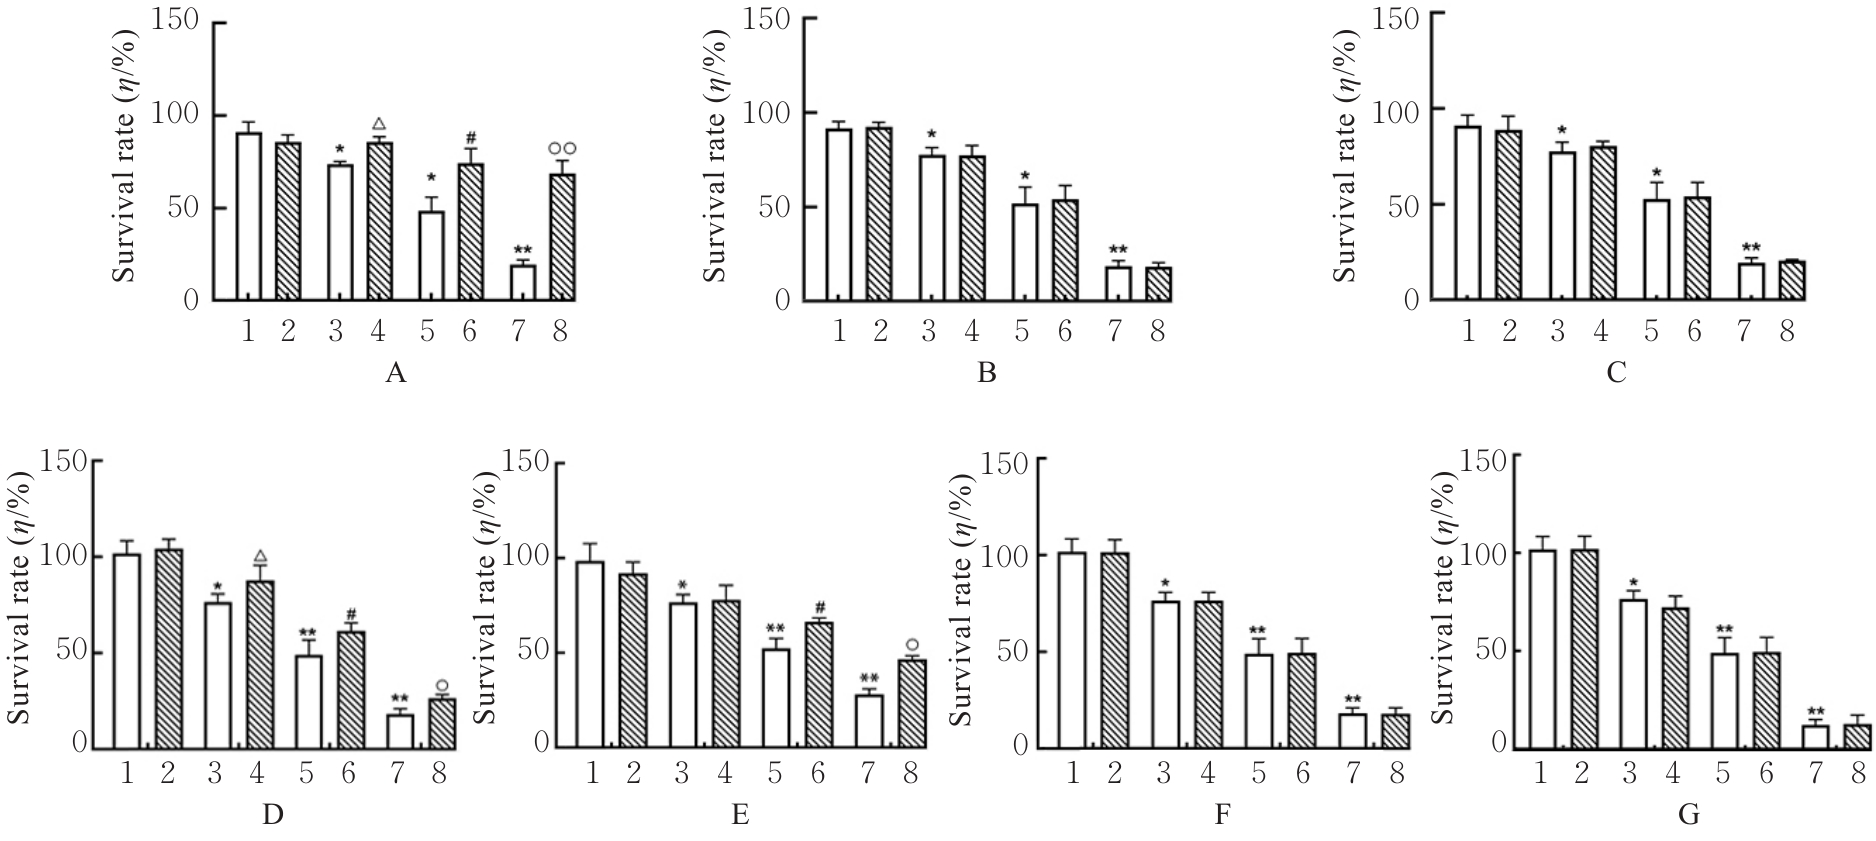
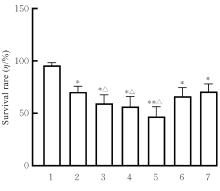
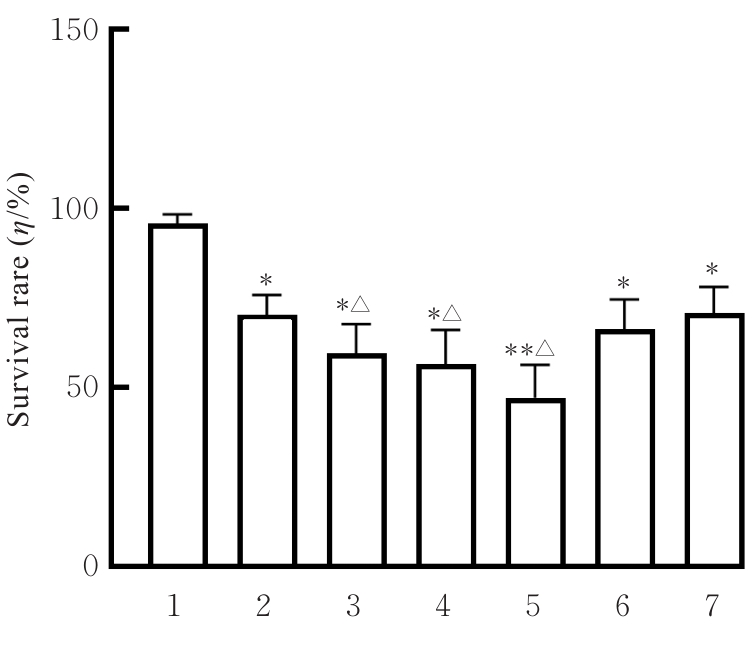
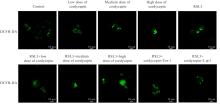
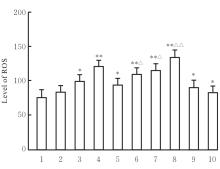
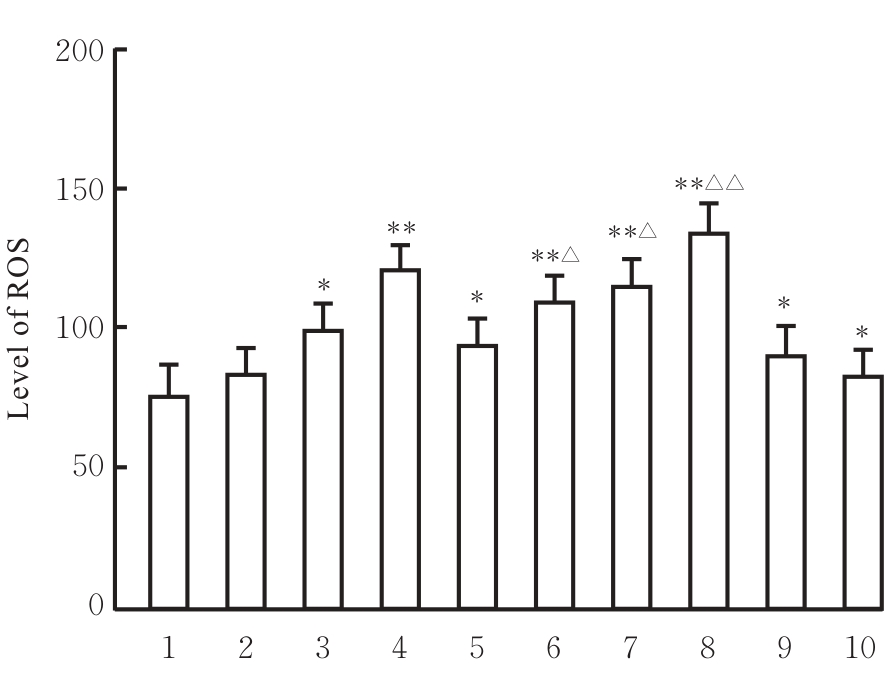
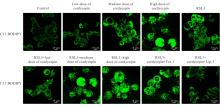
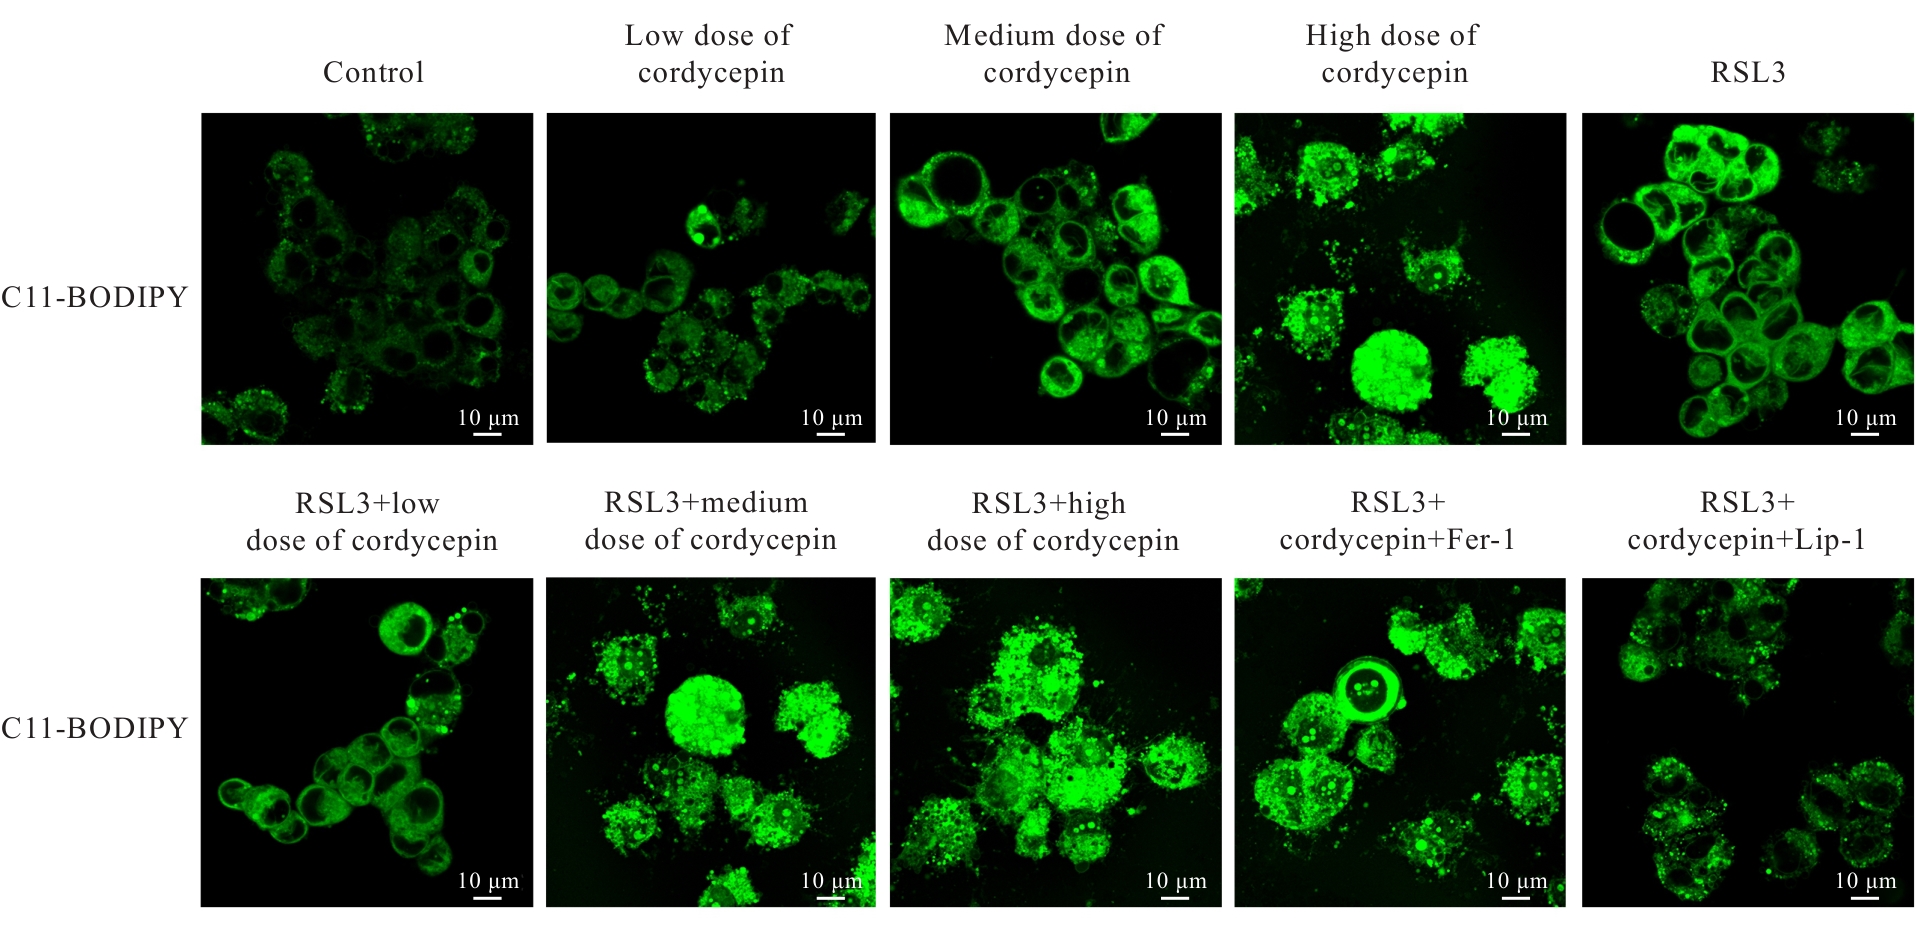
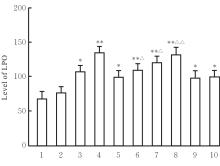
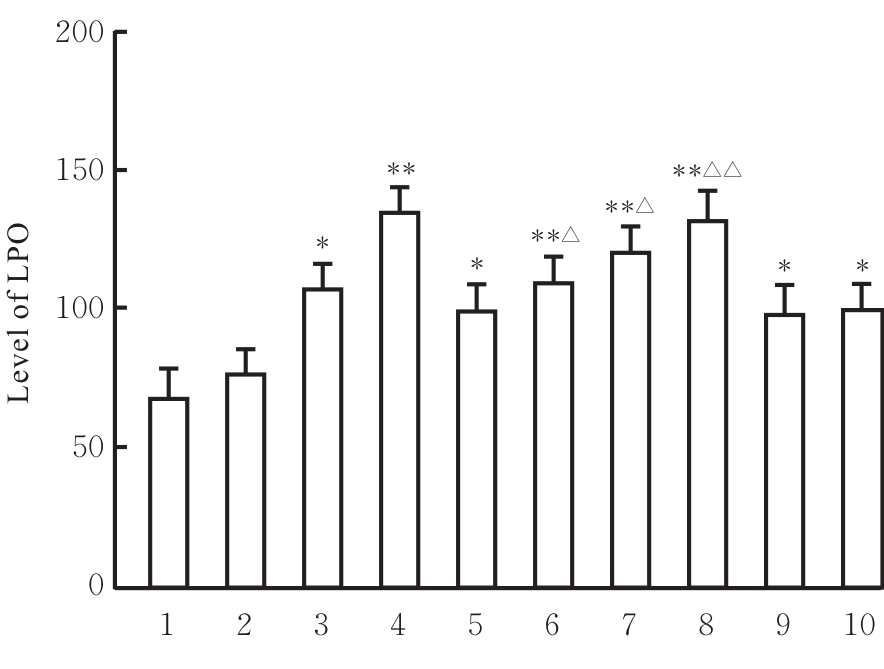
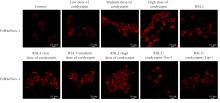
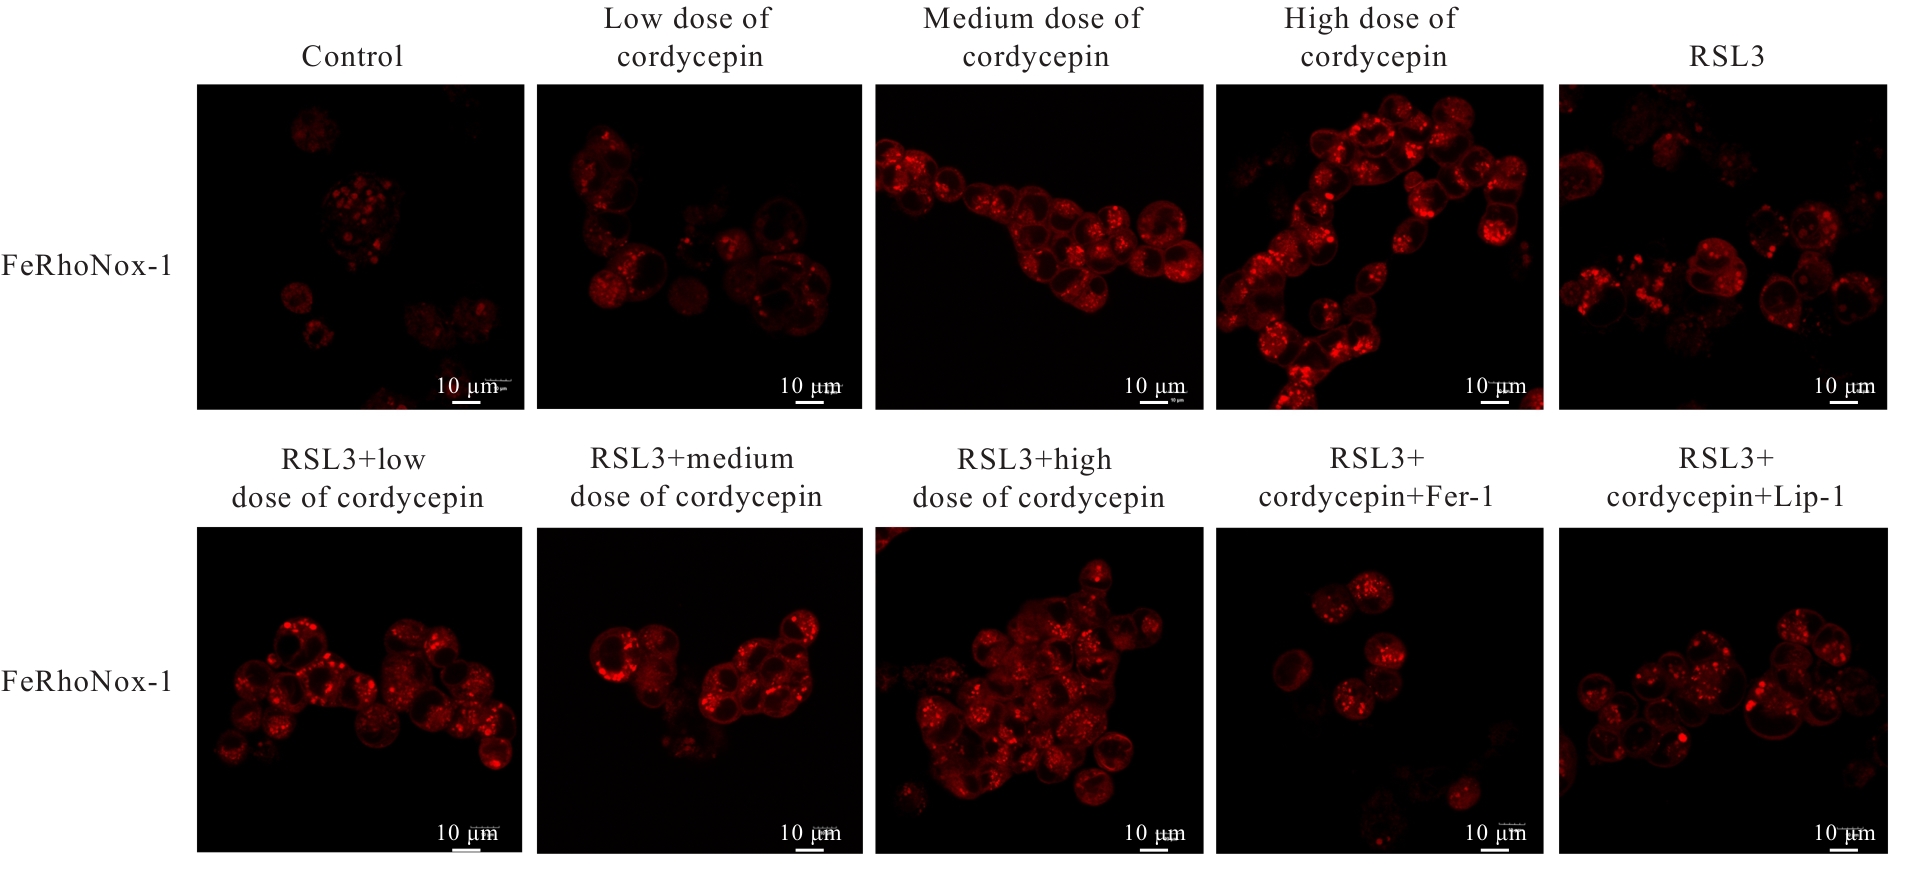
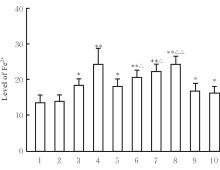
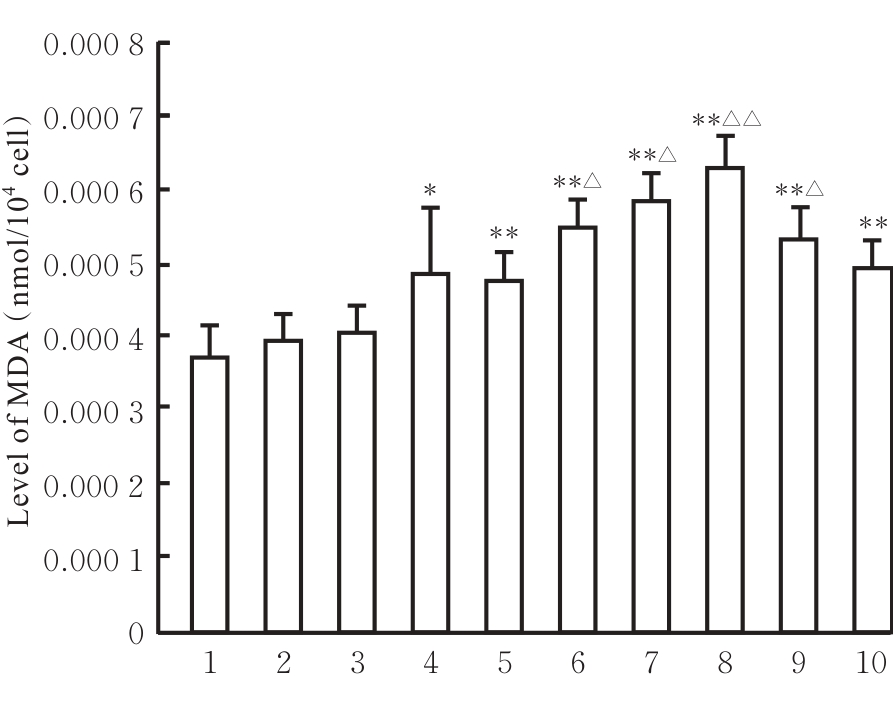
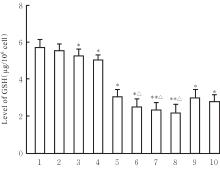
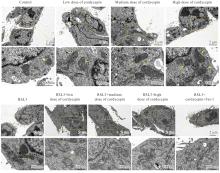
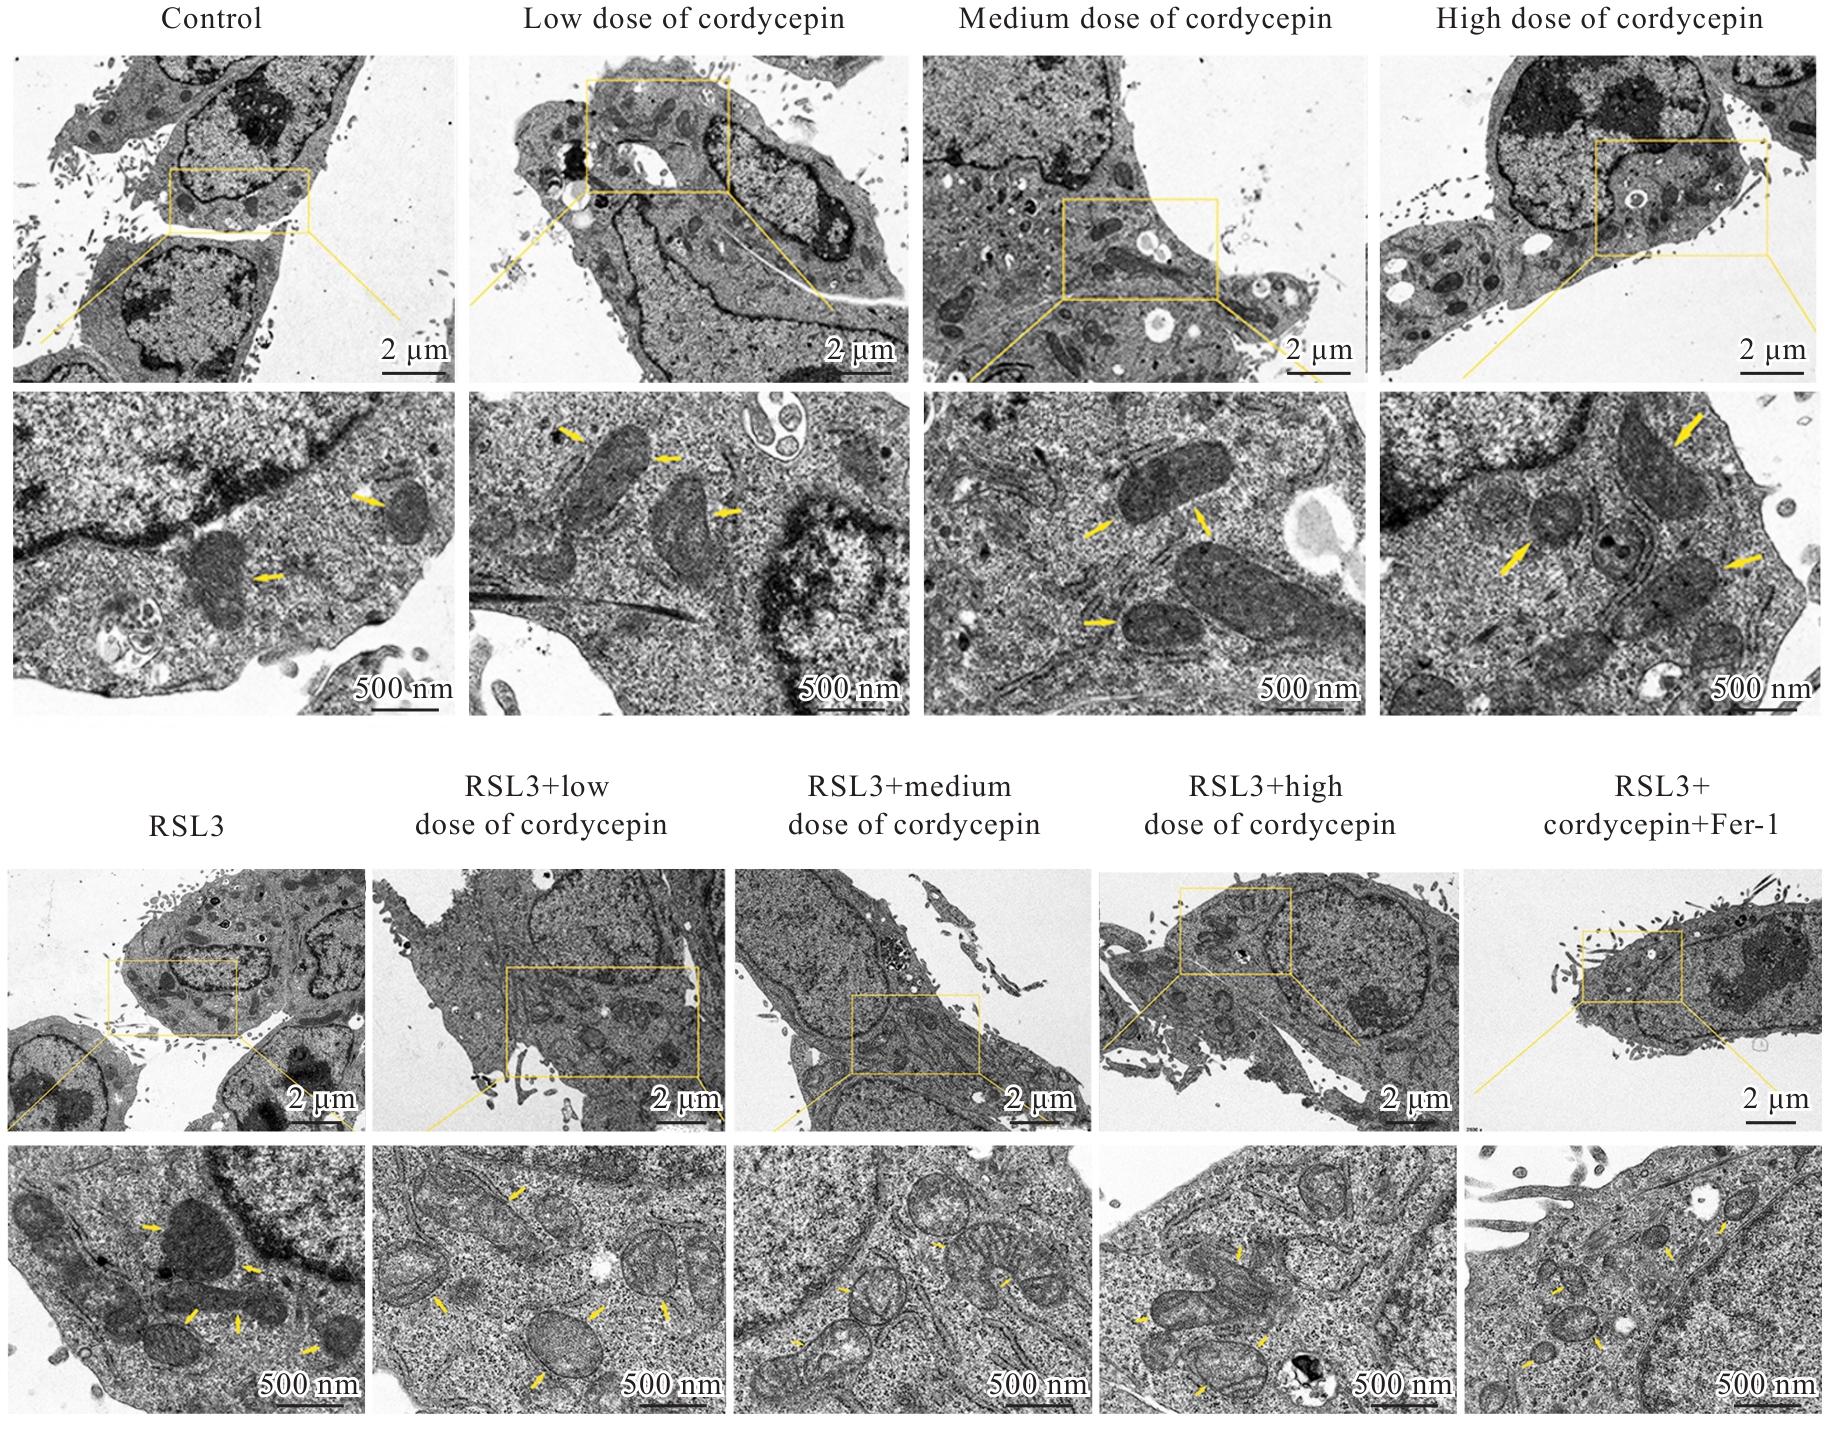
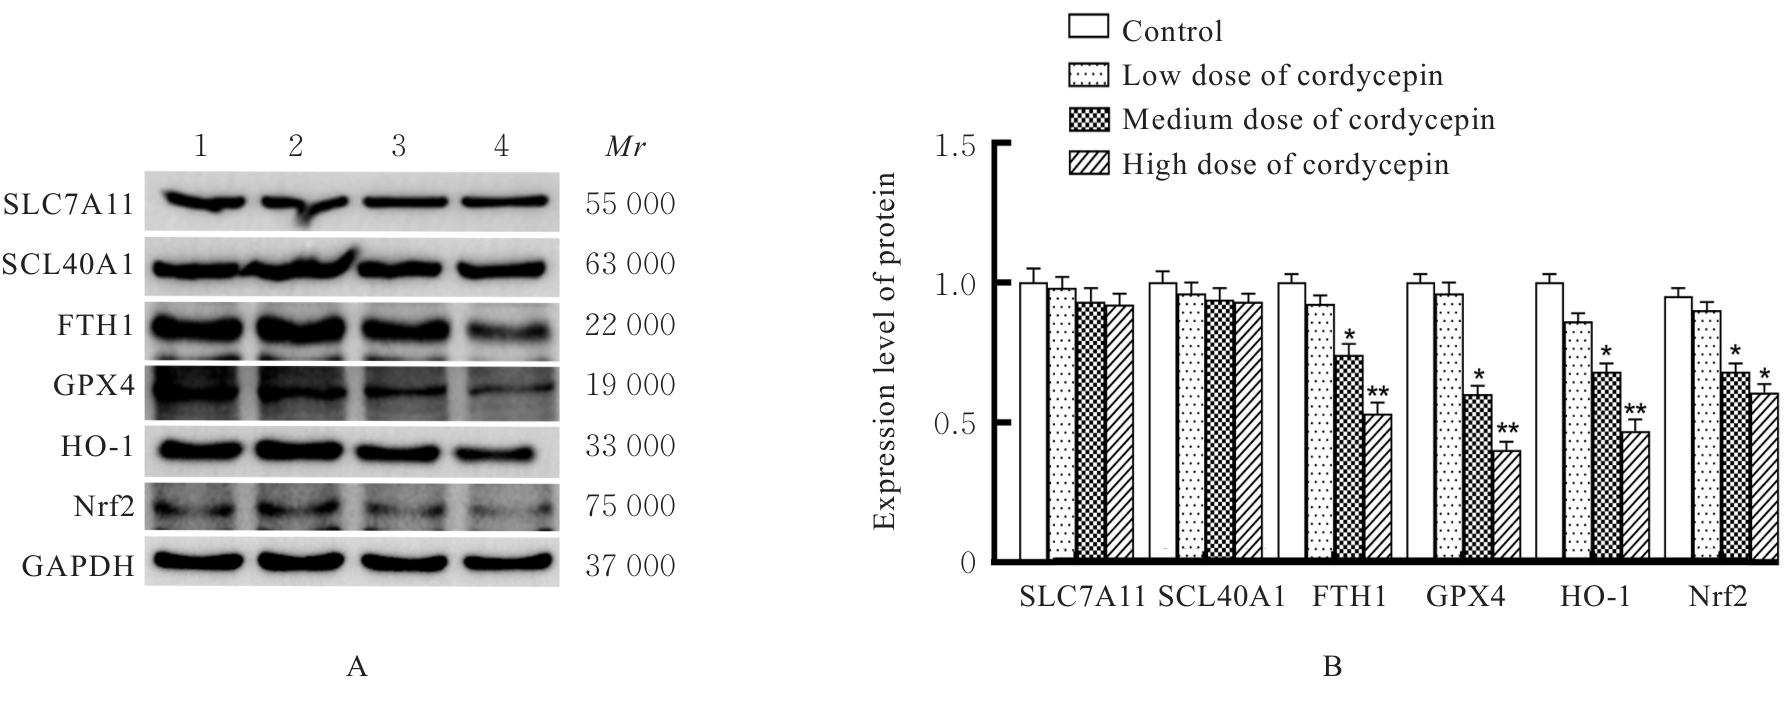
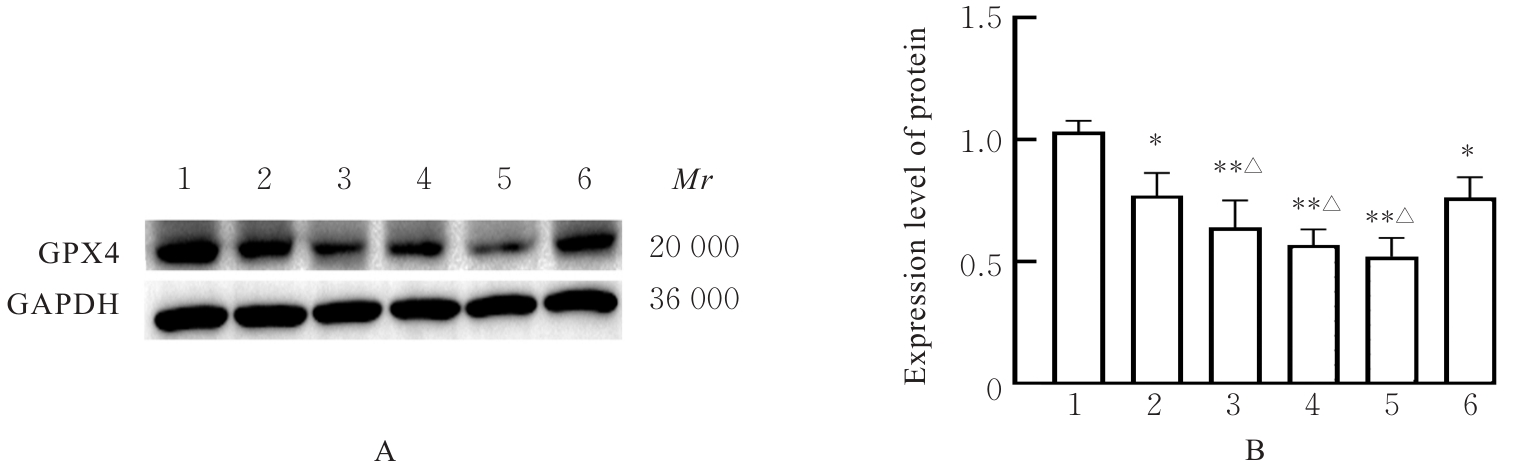
目的 探讨虫草素对铁死亡诱导剂RSL3诱导肝癌HepG2细胞铁死亡的增强作用,并阐明其潜在的作用机制。 方法 HepG2细胞分为对照组,RSL3组,低、中和高剂量虫草素组,RSL3组+低、中和高剂量虫草素组,RSL3+虫草素(中剂量)+铁死亡抑制剂Ferrostatin-1(Fer-1)组和RSL3+虫草素(中剂量)+铁死亡抑制剂Liproxstatin-1(Lip-1)组。采用0、1、5、10、15和20 μmol·L-1 RSL3分别干预HepG2、Huh-7及HCCLM3细胞24、48以及72 h,采用细胞计数试剂盒8(CCK-8)法检测各细胞活性,筛选RSL3最佳作用浓度和作用时间。分别采用0、50、100、200、400、600、800、1 000和1 200 μmol·L-1虫草素干预HepG2细胞24、48及72 h,采用CCK-8法检测细胞存活率,计算半数抑制浓度(IC50)值,筛选虫草素最佳作用浓度和作用时间。使用凋亡抑制剂Z-VAD-FMK、细胞自噬抑制剂Chloroquine(CQ)、细胞坏死性凋亡抑制剂Necrostatin-1(Nec-1)、Fer-1、Lip-1、Deferasirox和四甲基哌啶氧化物(TEMPO)分别干预HepG2细胞,计算HepG2细胞存活率。2',7'-二氯荧光素二乙酸酯(DCFH-DA)荧光探针法检测各组HepG2细胞中活性氧(ROS)水平,C11 BODIPY 581/591荧光探针法检测各组HepG2细胞中脂质过氧化(LPO)水平,FeRhoNox-1荧光探针法检测各组HepG2细胞中亚铁离子(Fe2+)水平,试剂盒检测HepG2细胞中谷胱甘肽(GSH)和丙二醛(MDA)水平,Western blotting法检测各组HepG2细胞中铁死亡相关蛋白、核转录因子E2相关因子2(Nrf2)和血红素氧合酶1(HO-1)蛋白表达水平,透射电镜观察各组HepG2细胞超微结构形态表现。 结果 CCK-8法,0.56 μmol·L-1 RSL3干预细胞时,3种细胞活性差异较明显。与0 μmol·L-1 RSL3组比较,6.4和12.8 μmol·L-1 RSL3组3种细胞存活率均明显降低(P<0.05)。HepG2细胞的IC50值最大,因此选择HepG2细胞进行后续实验。与0 μmol·L-1虫草素组比较,200、400、600、800、1 000和2 000 μmol·L-1虫草素组HepG2细胞存活率均明显降低(P<0.05或P<0.01)。选择0.5倍IC50值(267.9 μmol·L-1)、1倍IC50值(535.8 μmol·L-1)和1.5倍IC50值(803.7 μmol·L-1)分别作为低、中及高剂量虫草素组,干预时间为24 h。与对照组比较,低、中和高剂量虫草素组HepG2细胞存活率均明显降低(P<0.05或P<0.01)。与低、中和高剂量虫草素组比较,Z-VAD-FMK+低、中和高剂量虫草素组HepG2细胞存活率均明显升高(P<0.05或P<0.01),Fer-1+中和高剂量虫草素组及Lip-1+低、中和高剂量虫草素组HepG2细胞存活率均明显升高(P<0.05)。与对照组比较,RSL3组、RSL3+低、中和高剂量虫草素组、RSL3+虫草素+Fer-1组和RSL3+虫草素+Lip-1组HepG2细胞存活率均明显降低(P<0.05或P<0.01);与RSL3组比较,RSL3+低、中和高剂量虫草素组HepG2细胞存活率均明显降低(P<0.05)。DCFH-DA荧光探针法,与对照组比较,中和高剂量虫草素组、RSL3组和RSL3+低、中和高剂量虫草素组细胞中ROS水平均明显升高(P<0.05或P<0.01);与RLS3组比较,RSL3+低、中和高剂量虫草素组HepG2细胞中ROS水平均明显升高(P<0.05或P<0.01)。C11 BODIPY 581/591荧光探针法,与对照组比较,中和高剂量虫草素组、RSL3组和RSL3+低、中和高剂量虫草素组HepG2细胞中LPO水平均明显升高(P<0.05或P<0.01);与RSL3组比较,RSL3+低、中和高剂量虫草素组HepG2细胞中LPO水平均明显升高(P<0.05或P<0.01)。FeRhoNox-1荧光探针法,与对照组比较,中和高剂量虫草素组、RSL3组和RSL3+低、中和高剂量虫草素组HepG2细胞中Fe2+水平均明显升高(P<0.05或P<0.01);与RSL3组比较,RSL3+低、中和高剂量虫草素组HepG2细胞中Fe2+水平均明显升高(P<0.05或P<0.01)。与对照组比较,高剂量虫草素组、RSL3组和RSL3+低、中和高剂量虫草素组HepG2细胞中MAD水平均明显升高(P<0.05或P<0.01);与RSL3组比较,RSL3+低、中和高剂量虫草素组HepG2细胞中MAD水平均明显升高(P<0.05或P<0.01)。与对照组比较,中和高剂量虫草素组、RSL3组和RSL3+低、中和高剂量虫草素组HepG2细胞中GSH水平均明显降低(P<0.05或P<0.01);与RSL3组比较,RSL3+低、中和高剂量虫草素组HepG2细胞中GSH水平均明显降低(P<0.05)。与对照组比较,低和中剂量虫草素组HepG2细胞超微结构变化不明显,高剂量虫草素组部分细胞线粒体嵴减少,线粒体膜可见轻度肿胀和膜密度增高,线粒体膜中内膜结构轻度扭曲,RSL3组和RSL3+低、中及高剂量虫草素组均表现出铁死亡细胞超微结构变化;与RSL3组比较,RSL3+低、中和高剂量虫草素组表现为细胞线粒体膜破裂并伴有膜密度增高,线粒体膜中的内膜结构异常扭曲或扩张,线粒体嵴减少甚至消失。Western blotting法,与对照组比较,中和高剂量虫草素组HepG2细胞中FTH1和GPX4蛋白表达水平均明显降低(P<0.05或P<0.01),Nrf2和HO-1蛋白表达水平均明显降低(P<0.05或P<0.01),RSL3组和RSL3+虫草素+Fer-1组HepG2细胞中GPX4蛋白表达水平均明显降低(P<0.05或P<0.01);与RSL3组比较,RSL3+低、中和高剂量虫草素组HepG2细胞中GPX4蛋白表达水平均明显降低(P<0.05)。 结论 虫草素具有明显增强RSL3诱导肝癌HepG2细胞铁死亡的作用,并能够下调HepG2细胞中Nrf2和HO-1蛋白表达。

关键词: 肝细胞癌, 虫草素, 铁死亡, RSL3, 核因子E2相关因子2/血红素氧合酶1信号通路

Abstract:

Objective To discuss the enhancing effect of cordycepin on ferroptosis inducer RSL3-induced ferroptosis in the hepatocellular carcinoma HepG2 cells, and to clarify its potential mechanism. Methods The HepG2 cells were divided into control group, RSL3 group, low, medium and high doses of cordycepin groups, RSL3+low, medium and high doses of cordycepin groups, RSL3+medium-dose cordycepin+ferroptosis inhibitor Ferrostatin-1 (Fer-1) group, and RSL3+medium-dose cordycepin+ferroptosis inhibitor Liproxstatin-1 (Lip-1) group. The HepG2, Huh-7 and HCCLM3 cells were treated with 0, 1, 5, 10, 15 and 20 μmol·L-1 RSL3 for 24, 48 and 72 h, respectively. Cell counting kit-8(CCK-8) method was used to detect cell viability and determine the optimal concentration and treatment time of RSL3. The HepG2 cells were treated with 0, 50, 100, 200, 400, 600, 800, 1 000, and 1 200 μmol·L-1 cordycepin for 24, 48 and 72 h, respectively. CCK-8 method was used to detect the survival rate of the cells and the half maximal inhibitory concentration (IC50) was calculated to determine the optimal concentration and treatment time of cordycepin; the apoptosis inhibitor Z-VAD-FMK, autophagy inhibitor Chloroquine (CQ), necroptosis inhibitor Necrostatin-1 (Nec-1), Fer-1, Lip-1, Deferasirox and 2,2,6,6-tetramethylpiper idinoxy(TEMPO) were used to treat HepG2 cells, and the survival rate of the cells was calculated; 2',7'-Dichlorodihydrofluorescein diacetate (DCFH-DA) fluorescence probe was used to detect reactive oxygen species (ROS) levels in the HepG2 cells in various groups; C11 BODIPY 581/591 fluorescence probe was used to detect lipid peroxidation (LPO) levels in the HepG2 cells in various groups; FeRhoNox-1 fluorescent probe was used to detect ferrous ion (Fe2+) levels in the HepG2 cells in various groups; kits were used to detect glutathione (GSH) and malondialdehyde (MDA) levels in the HepG2 cells; Western blotting method was used to detect the expression levels of ferroptosis-related proteins, nuclear factor erythroid 2-related factor 2 (Nrf2) and heme oxygenase-1 (HO-1) proteins in the hepG2 cells in various groups; transmission electron microscope was used to observe the ultrastructural morphology of the HepG2 cells in various groups. Results The CCK-8 results showed that when the cells were treated with 0.56 μmol·L?1 RSL3, the viabilities of the three cell types differed significantly. Compared with 0 μmol·L?1 RSL3 group, the survival rates of the cells in 6.4 and 12.8 μmol·L-1 RSL3 groups were significantly decreased (P<0.05). The HepG2 cells had the highest IC50 value and were selected for subsequent experiments. Compared with 0 μmol·L-1 cordycepin group, the survival rates of the HepG2 cells in 200, 400, 600, 800, 1 000, and 2 000 μmol·L-1 cordycepin groups were significantly decreased (P<0.05 or P<0.01). 0.5×IC50 (267.9 μmol·L-1), 1×IC50 (535.8 μmol·L-1) and 1.5×IC50 (803.7 μmol·L-1) were selected as low, medium and high doses of cordycepin groups, respectively, with an intervention time of 24 h. Compared with control group, the survival rates of the HepG2 cells in low, medium, and high doses of cordycepin groups were significantly decreased (P<0.05). Compared with low, medium, and high doses of cordycepin groups, the survival rates of the HepG2 cells in Z-VAD-FMK+low, medium, and high doses of cordycepin groups were significantly increased (P<0.01), and those in Fer-1+medium and high doses of cordycepin groups and Lip-1+low, medium, and high doses of cordycepin groups were significantly increased (P<0.05). Compared with control group, the survival rates of the HepG2 cells in RSL3 group, RSL3+low, medium, and high doses of cordycepin groups, RSL3+cordycepin+Fer-1 group and RSL3+cordycepin+Lip-1 group were significantly decreased (P<0.05 or P<0.01). Compared with RSL3 group, the survival rates of the HepG2 cells in RSL3+low, medium, and high doses of cordycepin groups were significantly decreased (P<0.05). The DCFH-DA results showed that compared with control group, the ROS levels in the cells in medium and high doses of cordycepin groups, RSL3 group and RSL3+low, medium, and high doses of cordycepin groups were significantly increased (P<0.05 or P<0.01). The C11 BODIPY 581/591 results showed that compared with control group, the LPO levels in the HepG2 cells in medium and high doses of cordycepin groups, RSL3 group and RSL3+low, medium and high doses of cordycepin groups were significantly increased (P<0.05 or P<0.01). Compared with RSL3 group, the LPO levels in the HepG2 cells in RSL3+low, medium, and high doses of cordycepin groups were significantly increased (P<0.05 or P<0.01). The FeRhoNox-1 results showed that compared with control group, the Fe2+ levels in the HepG2 cells in medium and high doses of cordycepin groups, RSL3 group and RSL3+low, medium, and high doses of cordycepin groups were significantly increased (P<0.05 or P<0.01). Compared with RSL3 group, the Fe2+ levels in the HepG2 cells in RSL3+low, medium, and high doses of cordycepin groups were significantly increased (P<0.05 or P<0.01). Compared with control group, the MDA levels in the HepG2 cells in high doses of cordycepin group, RSL3 group and RSL3+low, medium, and high doses of cordycepin groups were significantly increased (P<0.05 or P<0.01). Compared with RSL3 group, the MDA levels in the HepG2 cells in RSL3+low, medium, and high doses of cordycepin groups were significantly increased (P<0.05 or P<0.01). Compared with control group, the GSH levels in the HepG2 cells in medium and high doses of cordycepin groups, RSL3 group and RSL3+low, medium, and high doses of cordycepin groups were significantly decreased (P<0.05 or P<0.01). Compared with RSL3 group, the GSH levels in the HepG2 cells in RSL3+low, medium, and high doses cordycepin groups were significantly decreased (P<0.05 or P<0.01). Compared with control group, the ultrastructure of the HepG2 cells in low and medium doses of cordycepin groups showed no significant changes, while the cells in high dose of cordycepin group exhibited reduced mitochondrial cristae, mild swelling and increased membrane density, with slightly distorted inner membrane structure. The cells in RSL3 group and RSL3+low, medium, and high doses of cordycepin groups all showed ultrastructural changes characteristic of ferroptosis. Compared with RSL3 group, the cells in RSL3+low, medium, and high doses of cordycepin groups exhibited ruptured mitochondrial membranes with increased membrane density, abnormally twisted or expanded inner membrane structures, and reduced or even disappeared mitochondrial cristae. The Western blotting results showed that compared with control group, the expression levels of FTH1 and GPX4 proteins in the HepG2 cells in medium and high doses of cordycepin groups were significantly decreased (P<0.05 or P<0.01), while the expression levels of Nrf2 and HO-1 proteins were significantly decreased (P<0.05 or P<0.01). Compared with control group, the expression levels of GPX4 protein in the HepG2 cells in low, medium and high doses of cordycepin groups, RSL3 group, and RSL3+cordycepin+Fer-1 group were significantly decreased (P<0.05). Compared with RSL3 group, the expression levels of GPX4 protein in the HepG2 cells in RSL3+low, medium, and high doses of cordycepin groups were significantly decreased (P<0.05). Conclusion Cordycepin can significantly enhance RSL3-induced ferroptosis in the hepatocellular carcinoma HepG2 cells and down-regulate the expression of Nrf2 and HO-1 proteins in the HepG2 cells.

Key words: Hepatocellular carcinoma, Cordycepin, Ferroptosis, RSL3, Nuclear factor erythroid 2-related factor 2/heme oxygenase-1 signaling pathway

中图分类号: 

  • R735.7