Journal of Jilin University(Medicine Edition) ›› 2025, Vol. 51 ›› Issue (3): 576-589.doi: 10.13481/j.1671-587X.20250303
• Research in basic medicine • Previous Articles
Improvement effect of cordycepin on ferroptosis in HepG2 cells induced by RSL3 and its mechanism
Han LIN1,Qiuyan YANG1,Jieyue ZHONG1,Bolun CHEN1,Wangxia TONG2( )
)
- 1.Graduate School,Guangxi University of Chinese Medicine,Guangxi 530001,China
2.Department of Medical Hepatology,Affiliated Ruikang Hospital,Guangxi University of Chinese Medicine,Nanning 530004,China
-
Received:2024-07-24Accepted:2024-09-17Online:2025-05-28Published:2025-07-18 -
Contact:Wangxia TONG E-mail:twx_01@126.com
CLC Number:
- R735.7
Cite this article
Han LIN,Qiuyan YANG,Jieyue ZHONG,Bolun CHEN,Wangxia TONG. Improvement effect of cordycepin on ferroptosis in HepG2 cells induced by RSL3 and its mechanism[J].Journal of Jilin University(Medicine Edition), 2025, 51(3): 576-589.
share this article
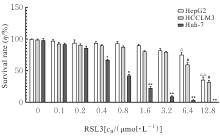
Fig. 1
Survival rates of HepG2, Huh-7, and HCCLM3 cells after interfered with different concentrations of RSL3"

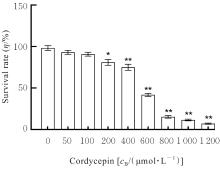
Fig. 2
Survival rates of HepG2 cells after interfered with different concentrations of cordycepin"
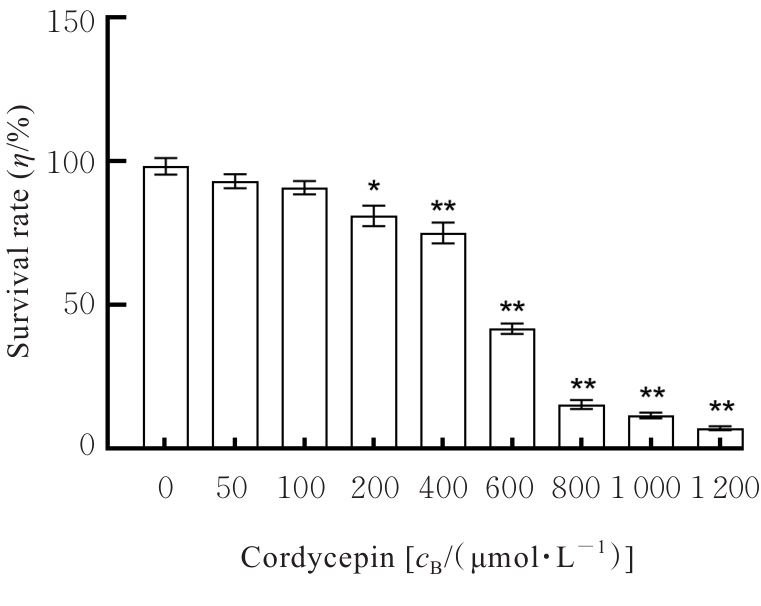
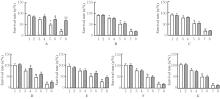
Fig. 3
Survival rates of HepG2 cells in various groups after interfered with different concentrations of iron death inhibitors"
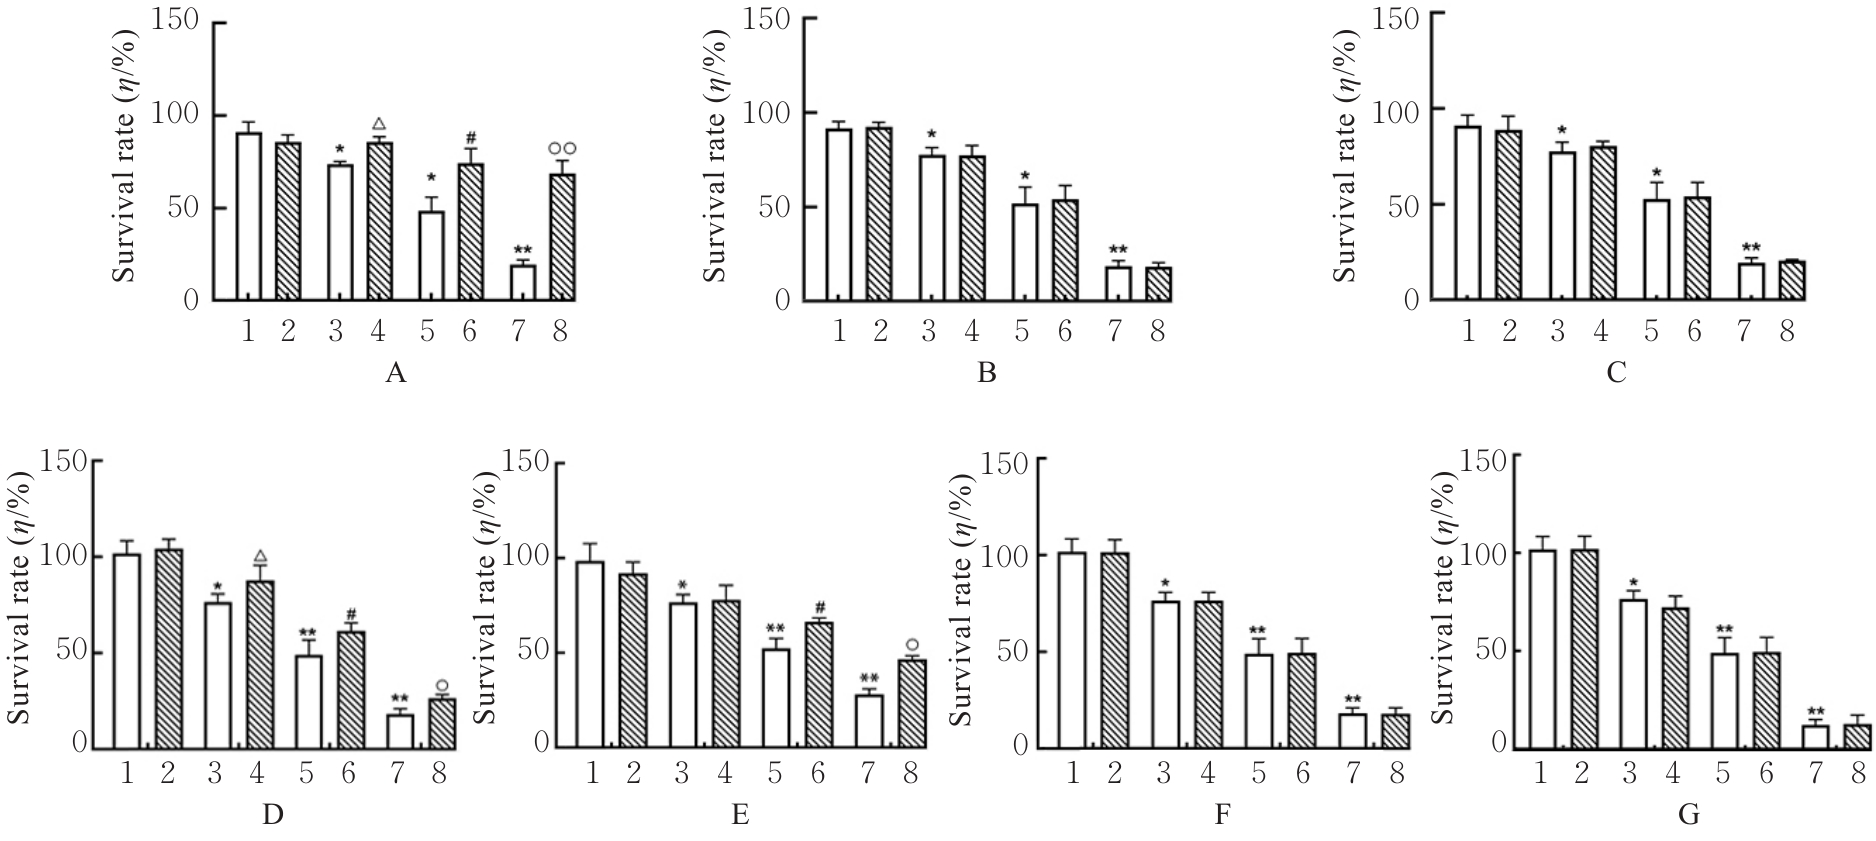
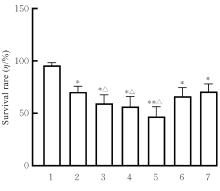
Fig. 4
Survival rates of HepG2 cells in various groups"
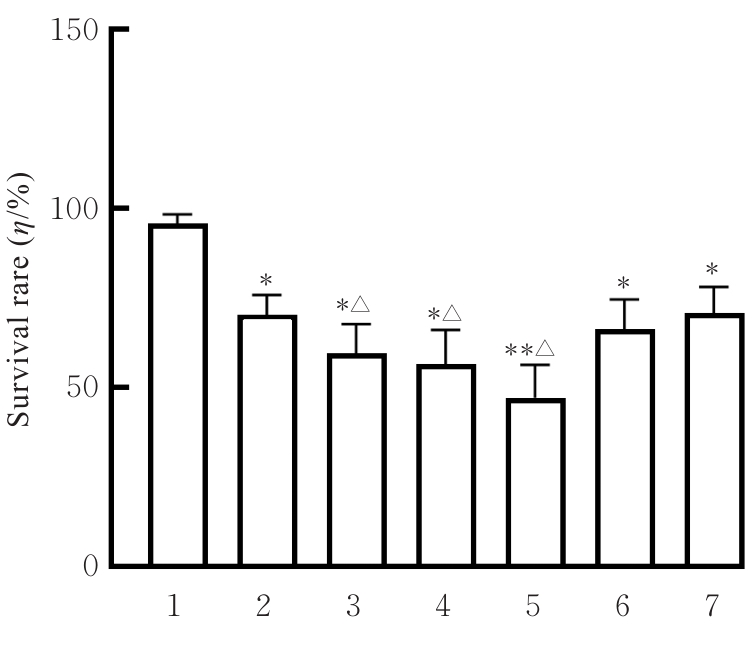
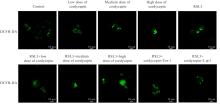
Fig. 5
Levels of ROS in HepG2 cells in various groups detected by DCFH-DA fluorescence probe method"

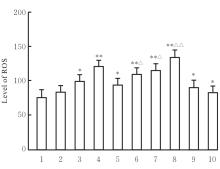
Fig. 6
Levels of ROS in HepG2 cells in various groups"
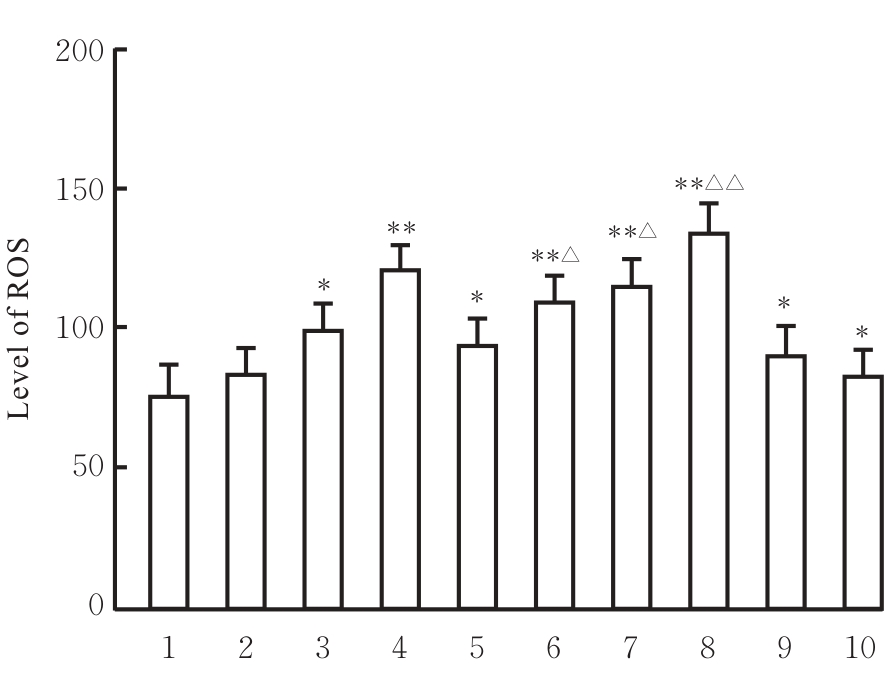
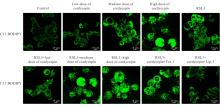
Fig. 7
Levels of LPO in HepG2 cells in various groups detected by C11 BODIPY 581/591 fluorescence probe method"
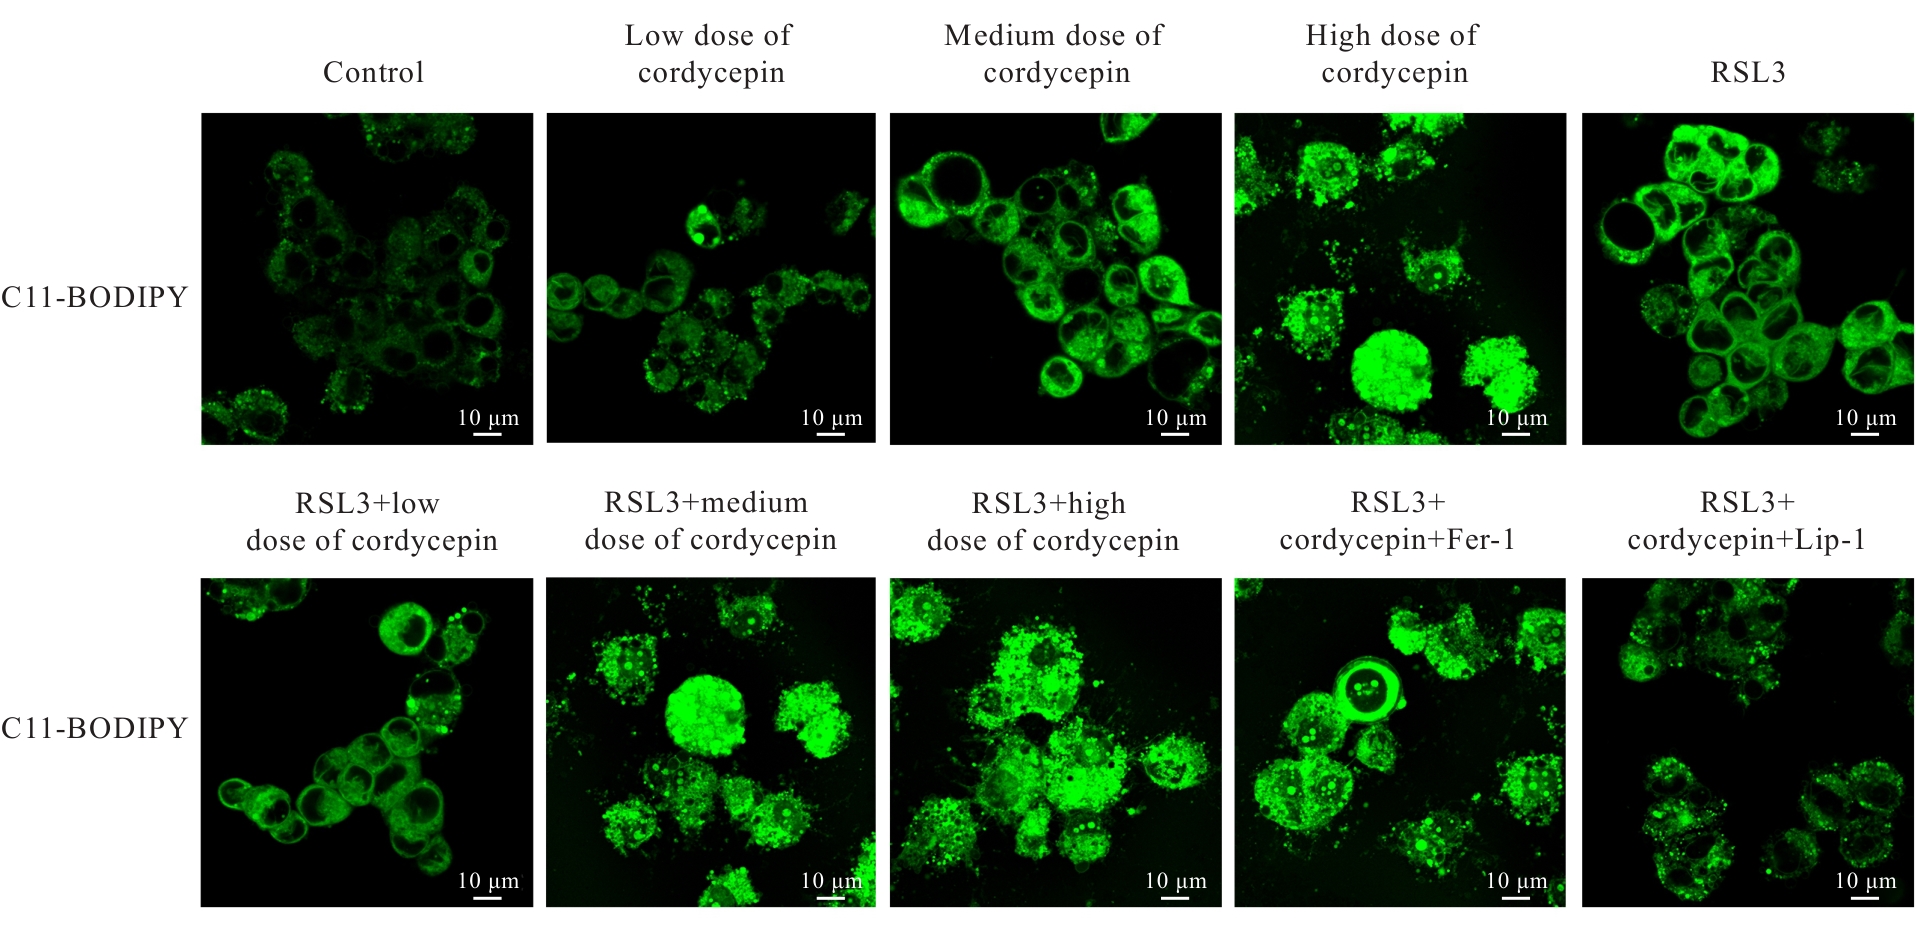
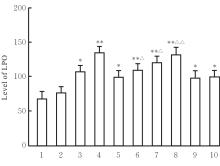
Fig. 8
Levels of LPO in HepG2 cells in various groups"
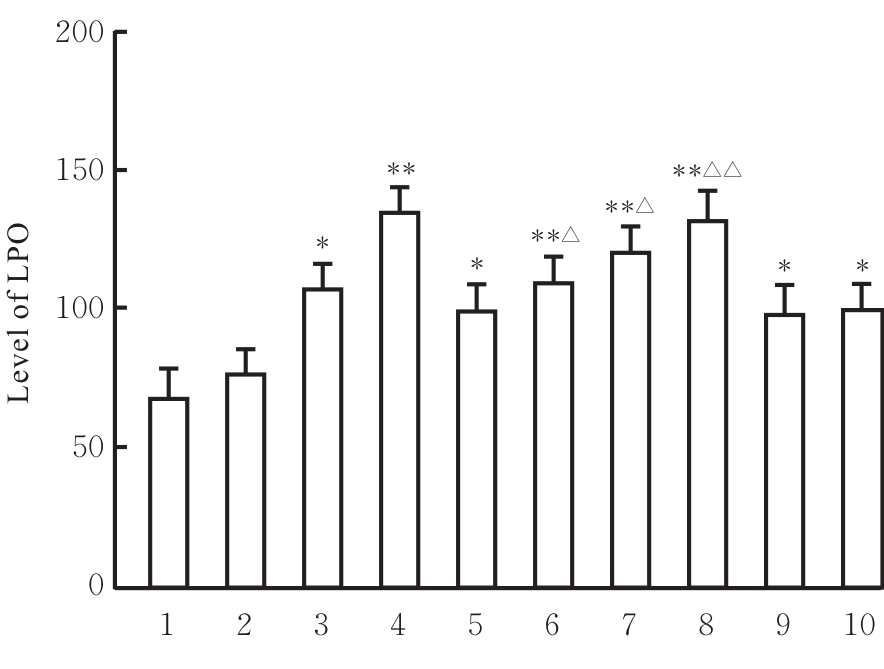
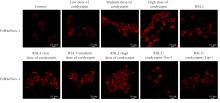
Fig. 9
Levels of Fe2+ in HepG2 cells in various groups detected by FeRhoNox-1 fluorescence probe method"
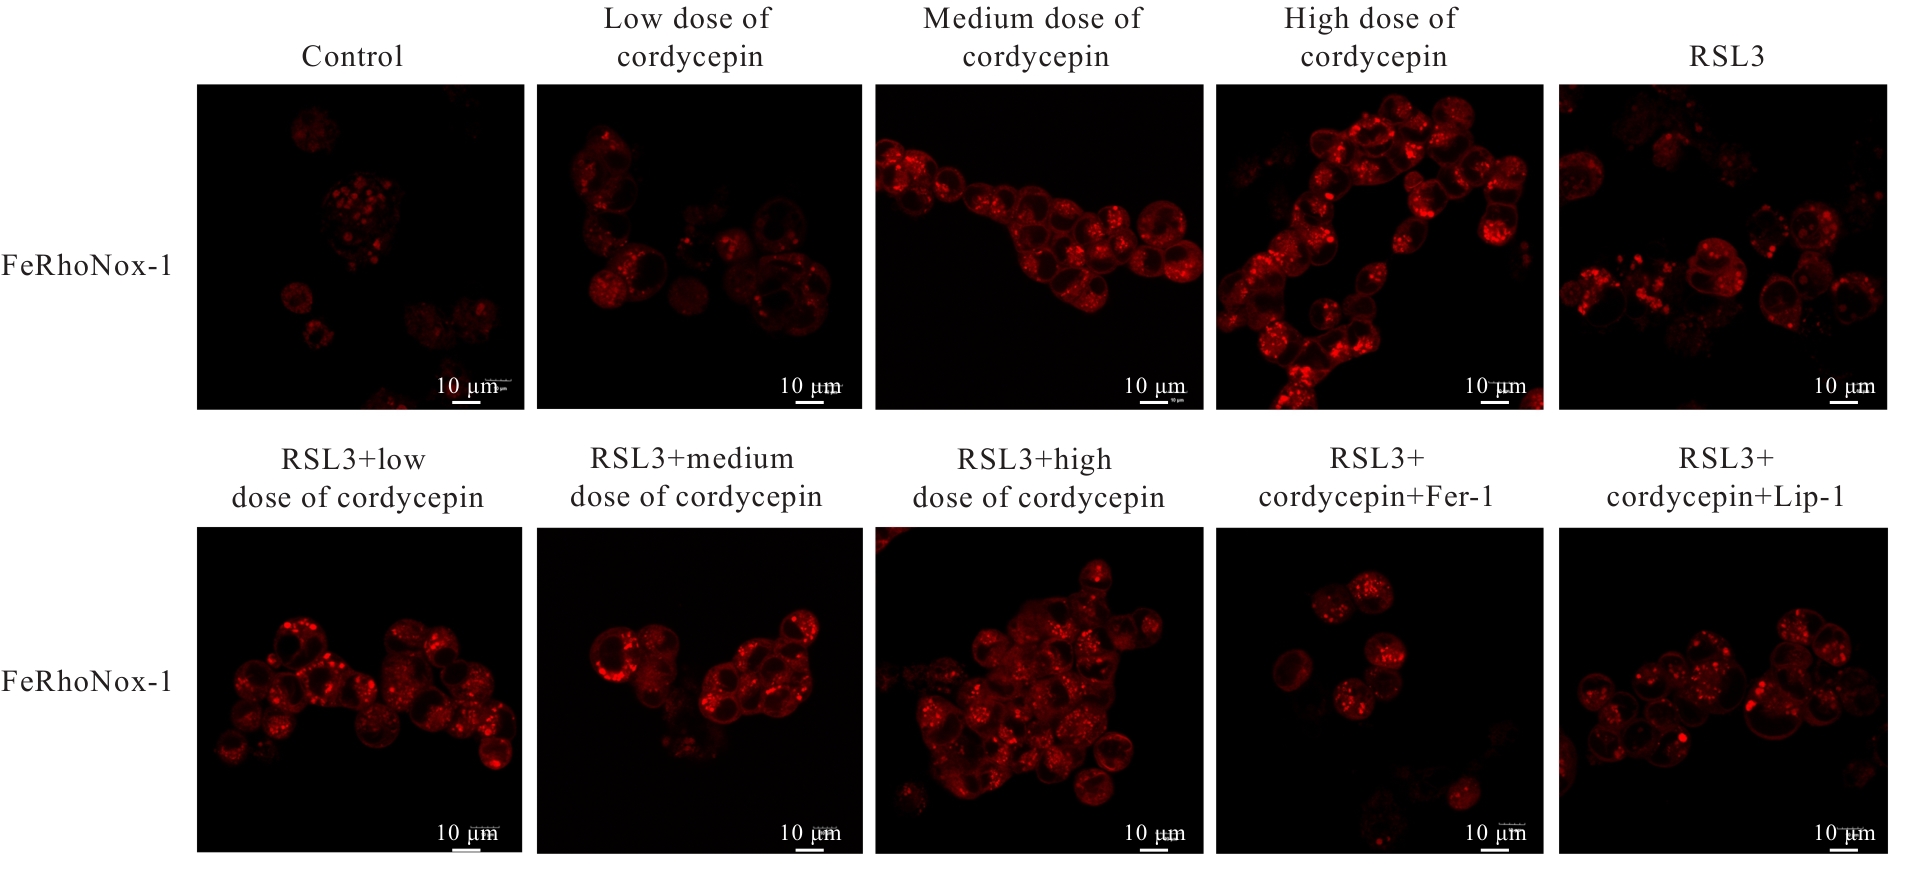
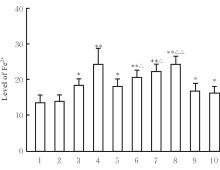
Fig. 10
Levels of Fe2+ in HepG2 cells in various groups"


Fig. 11
Levels of MDA in HepG2 cells in various groups"
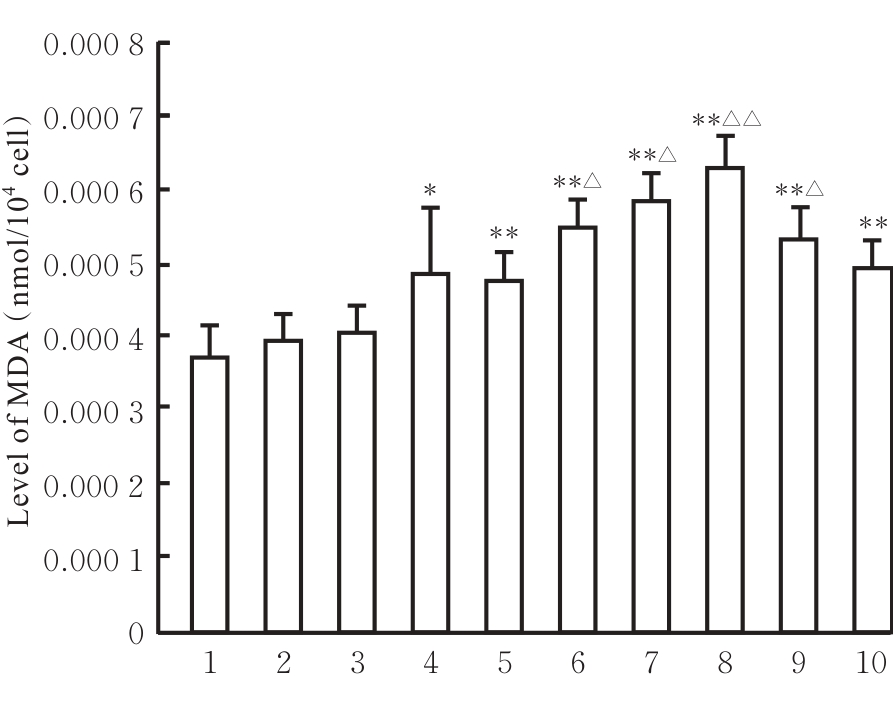
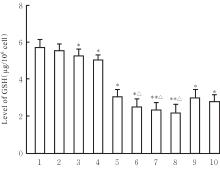
Fig. 12
Levels of GSH in HepG2 cells in various groups"

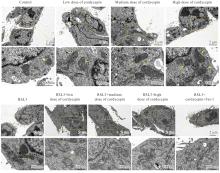
Fig. 13
Ultrastructural morphology of HepG2 cells in various groups observed by transmission electron microscope"
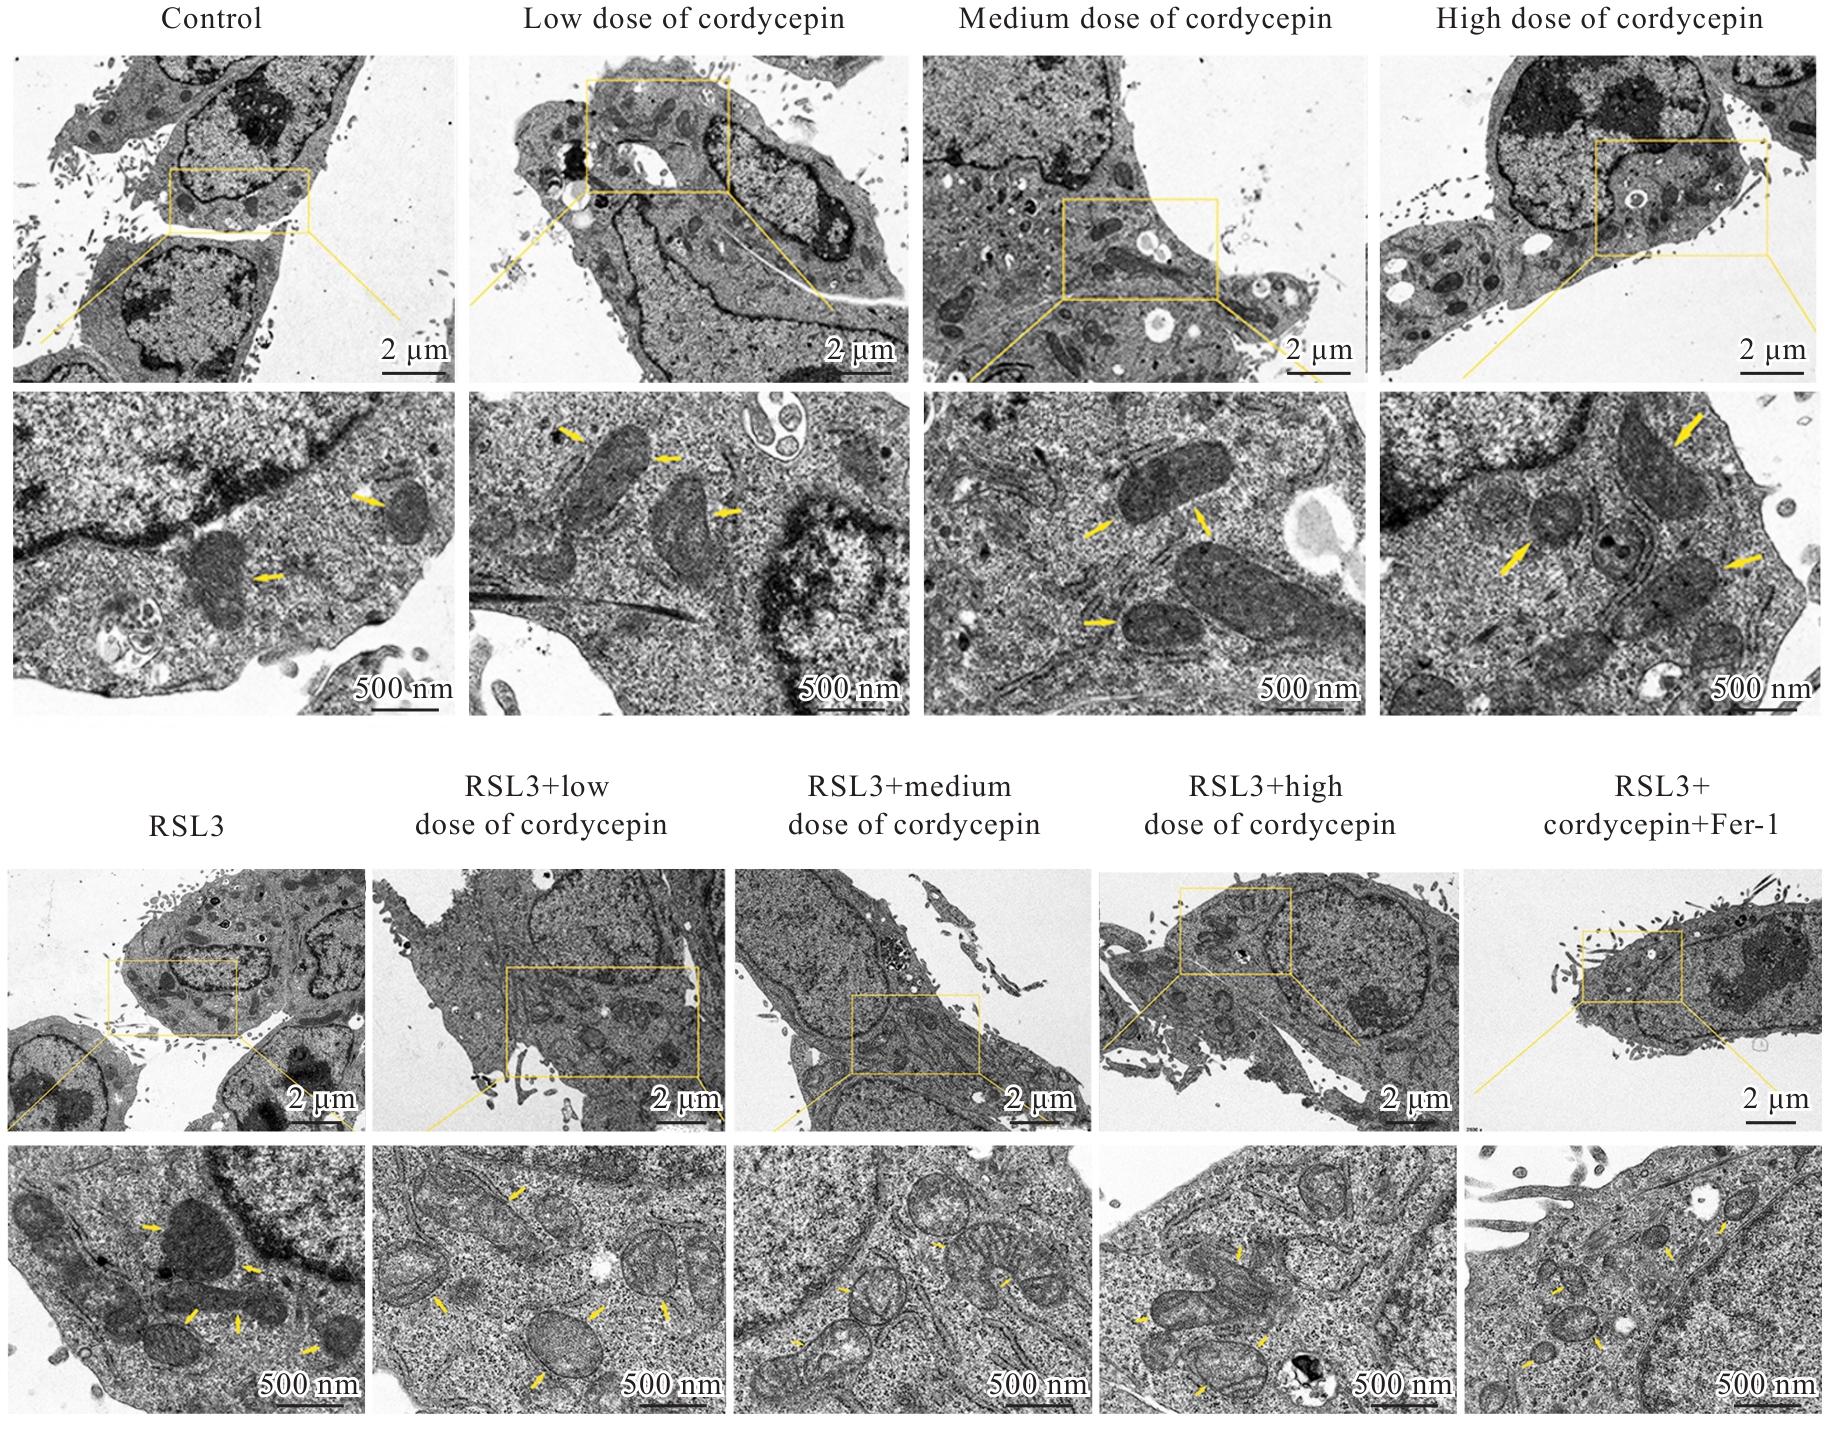

Fig. 14
Electrophoregram(A) and histogram(B) of expressions of iron death-related proteins, Nrf2, and HO-1 proteins in HepG2 cells in various groups after interved by cordycepin detected by Western blotting method"
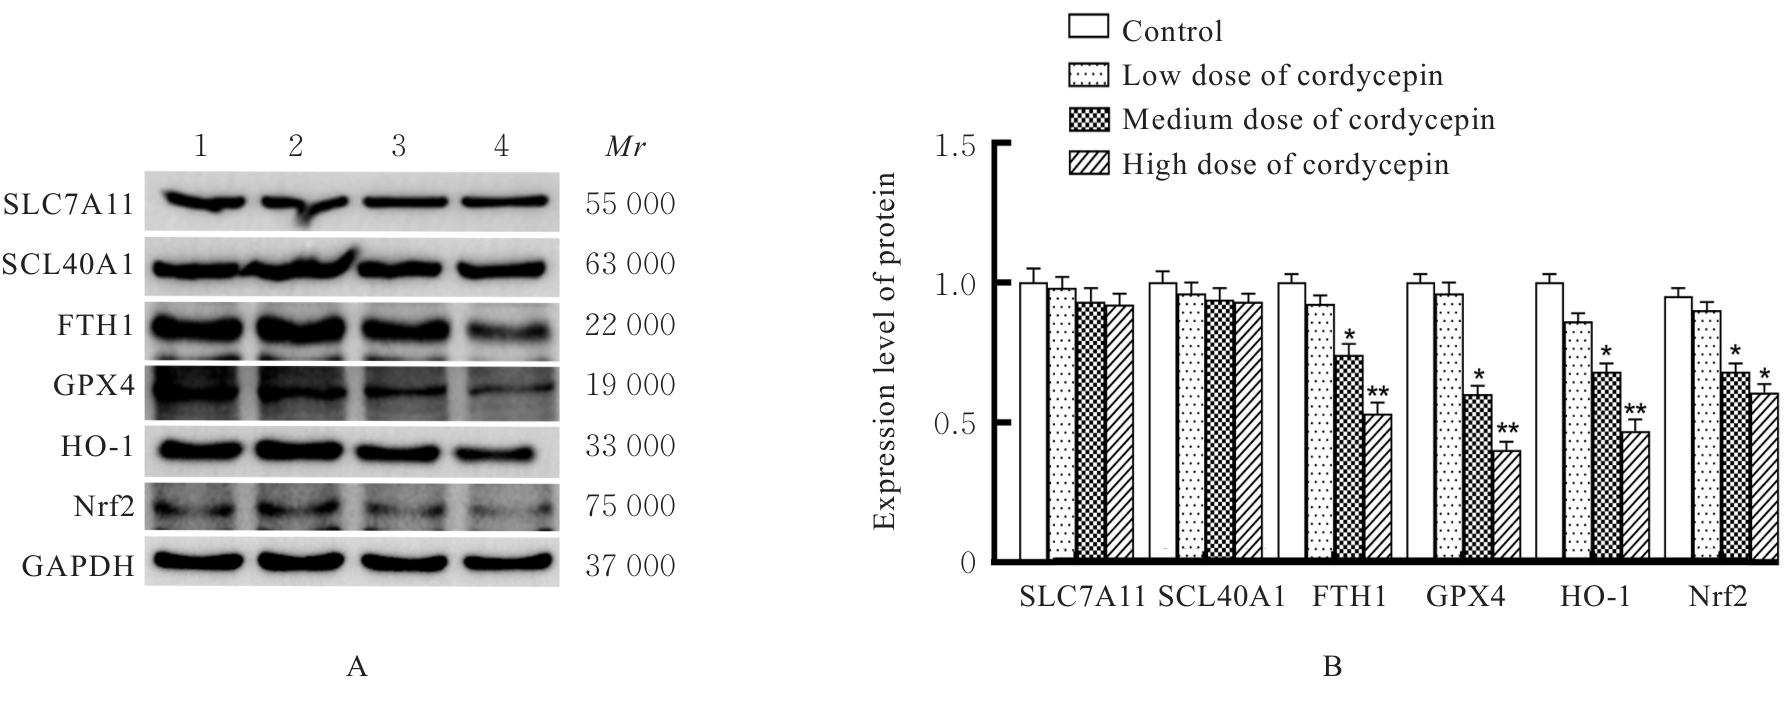
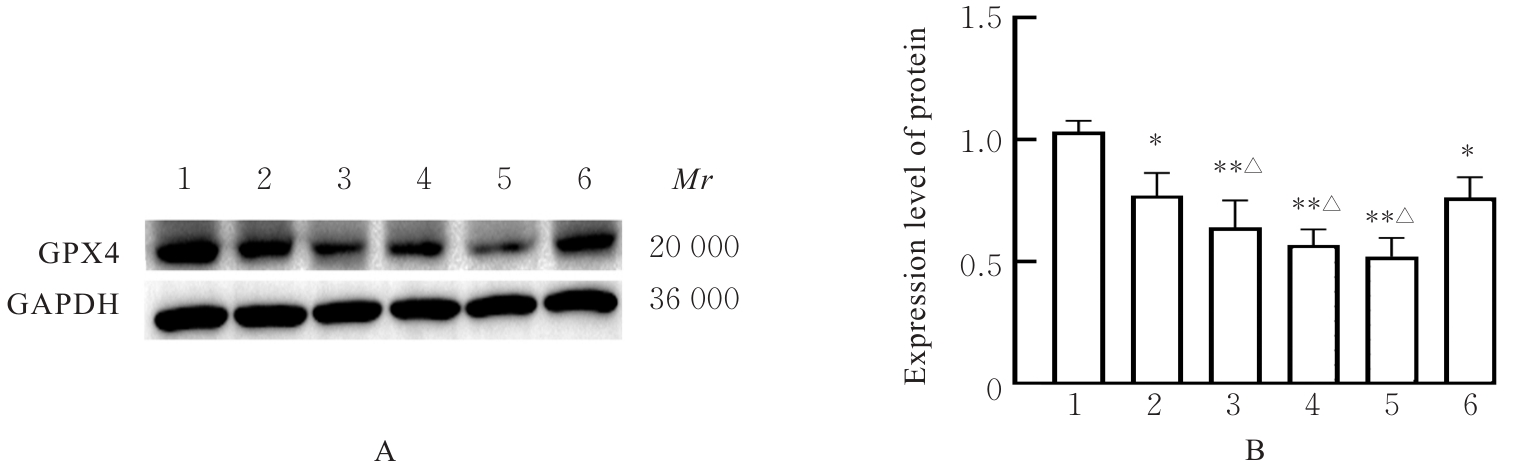
Fig. 15
Electrophoregram(A) and histogram(B) of expressions of GPX4 protein in HepG2 cells in various groups detected by Western blotting method"
| [1] | HARTKE J, JOHNSON M, GHABRIL M. The diagnosis and treatment of hepatocellular carcinoma[J]. Semin Diagn Pathol, 2017, 34(2): 153-159. |
| [2] | LLOVET J M, KELLEY R K, VILLANUEVA A, et al. Hepatocellular carcinoma[J]. Nat Rev Dis Primers, 2021, 7(1): 6. |
| [3] | VILLANUEVA A. Hepatocellular carcinoma[J]. N Engl J Med, 2019, 380(15): 1450-1462. |
| [4] | WONG K M, KING G G, HARRIS W P. The treatment landscape of advanced hepatocellular carcinoma[J]. Curr Oncol Rep, 2022, 24(7): 917-927. |
| [5] | 贾建国, 马向明, 田菲, 等.甘油三酯与高密度脂蛋白胆固醇比值(TG/HDL-C)对原发性肝癌发病的影响[J]. 临床肝胆病杂志, 2024, 40(4): 753-759. |
| [6] | KELLEY R K, RIMASSA L, CHENG A L, et al. Cabozantinib plus atezolizumab versus sorafenib for advanced hepatocellular carcinoma (COSMIC-312): a multicentre, open-label, randomised, phase 3 trial[J]. Lancet Oncol, 2022, 23(8): 995-1008. |
| [7] | MCGLYNN K A, PETRICK J L, EL-SERAG H B. Epidemiology of hepatocellular carcinoma[J]. Hepatology, 2021, 73(): 4-13. |
| [8] | STOCKWELL B R. Ferroptosis turns 10: Emerging mechanisms, physiological functions, and therapeutic applications[J]. Cell, 2022, 185(14): 2401-2421. |
| [9] | YANG R Y, GAO W H, WANG Z B, et al. Polyphyllin I induced ferroptosis to suppress the progression of hepatocellular carcinoma through activation of the mitochondrial dysfunction via Nrf2/HO-1/GPX4 axis[J]. Phytomedicine, 2024, 122: 155135. |
| [10] | GUO Z R, CHEN W, DAI G S, et al. Cordycepin suppresses the migration and invasion of human liver cancer cells by downregulating the expression of CXCR4[J]. Int J Mol Med, 2020, 45(1): 141-150. |
| [11] | LU Q, MEI W J, LUO S H, et al. Apoptosis of Bel-7402 human hepatoma cells induced by a ruthenium(Ⅱ) complex coordinated by cordycepin through the p53 pathway[J]. Mol Med Rep, 2015, 11(6): 4424-4430. |
| [12] | RADHI M, ASHRAF S, LAWRENCE S, et al. A systematic review of the biological effects of cordycepin[J]. Molecules, 2021, 26(19): 5886. |
| [13] | ZHOU Y L, GUO Z H, MENG Q F, et al. Cordycepin affects multiple apoptotic pathways to mediate hepatocellular carcinoma cell death[J]. Anticancer Agents Med Chem, 2017, 17(1): 143-149. |
| [14] | ZENG Y M, LIAN S Y, LI D F, et al. Anti-hepatocarcinoma effect of cordycepin against NDEA-induced hepatocellular carcinomas via the PI3K/Akt/mTOR and Nrf2/HO-1/NF-κB pathway in mice[J]. Biomed Pharmacother, 2017, 95: 1868-1875. |
| [15] | DIXON S J, LEMBERG K M, LAMPRECHT M R, et al. Ferroptosis: an iron-dependent form of nonapoptotic cell death[J]. Cell, 2012, 149(5): 1060-1072. |
| [16] | HSIEH C H, HSIEH H C, SHIH F S, et al. An innovative NRF2 nano-modulator induces lung cancer ferroptosis and elicits an immunostimulatory tumor microenvironment[J]. Theranostics, 2021, 11(14): 7072-7091. |
| [17] | KHAN A, HUO Y, GUO Y L, et al. Ferroptosis is an effective strategy for cancer therapy[J]. Med Oncol, 2024, 41(5): 124. |
| [18] | KREMER D M, NELSON B S, LIN L, et al. GOT1 inhibition promotes pancreatic cancer cell death by ferroptosis[J]. Nat Commun, 2021, 12(1): 4860. |
| [19] | ZHANG Y, TAN H, DANIELS J D, et al. Imidazole ketone erastin induces ferroptosis and slows tumor growth in a mouse lymphoma model[J]. Cell Chem Biol, 2019, 26(5): 623-633.e9. |
| [20] | CHENG L, JIN X, LU W Y, et al. Effect and involved mechanism of RSL3-induced ferroptosis in acute leukemia cells MOLM13 and drug-resistant cell lines[J]. Zhongguo Shi Yan Xue Ye Xue Za Zhi, 2021, 29(4): 1109-1118. |
| [21] | HAO W Y, SUN N, FAN Y Y, et al. Targeted ferroptosis-immunotherapy synergy: enhanced antiglioma efficacy with hybrid nanovesicles comprising NK cell-derived exosomes and RSL3-loaded liposomes[J]. ACS Appl Mater Interfaces, 2024, 16(22): 28193-28208. |
| [22] | 王柏乔, 何宇轩, 高京, 等. 中药干预间充质干细胞衰老的研究进展[J]. 郑州大学学报(医学版), 2024, 59(6): 746-751. |
| [23] | TANIA M, SHAWON J, SAIF K, et al. Cordycepin downregulates cdk-2 to interfere with cell cycle and increases apoptosis by generating ROS in cervical cancer cells: in vitro and in silico study[J]. Curr Cancer Drug Targets, 2019, 19(2): 152-159. |
| [24] | LIN L T, LAI Y J, WU S C, et al. Optimal conditions for cordycepin production in surface liquid-cultured Cordyceps militaris treated with porcine liver extracts for suppression of oral cancer[J]. J Food Drug Anal, 2018, 26(1): 135-144. |
| [25] | BI Y E, ZHOU Y L, WANG M Q, et al. Targeted delivery of cordycepin to liver cancer cells using transferrin-conjugated liposomes[J]. Anticancer Res, 2017, 37(9): 5207-5214. |
| [26] | DONG J L, LI Y, XIAO H W, et al. Cordycepin sensitizes breast cancer cells toward irradiation through elevating ROS production involving Nrf2[J]. Toxicol Appl Pharmacol, 2019, 364: 12-21. |
| [27] | 任晓彤, 余顺杰, 郭欣雨, 等. 骨髓增生异常综合征CD34+细胞焦亡相关分子焦孔素E研究[J]. 中国实用内科杂志, 2024, 44(1): 68-74. |
| [28] | YANG J W, MO J J, DAI J J, et al. Cetuximab promotes RSL3-induced ferroptosis by suppressing the Nrf2/HO-1 signalling pathway in KRAS mutant colorectal cancer[J]. Cell Death Dis, 2021, 12(11): 1079. |
| [29] | 杨 俊, 黄欣林, 覃汉俊, 等. 纳米凝胶搭载的siRNA通过靶向抑制施万细胞铁死亡促进周围神经损伤修复[J]. 中国医学物理学杂志, 2024, 41(4): 495-503. |
| [1] | Liang LI,Xiangdong ZHOU,Jie WANG,Chaoqun XU,Mengxia ZHU,Shanjun YU,Qi LI. Effect of bitter-taste receptor T2R38 activation on ferroptosis of human airway epithelium NuLi-1 cells induced by cigarette smoke exposure and its mechanism [J]. Journal of Jilin University(Medicine Edition), 2025, 51(2): 333-340. |
| [2] | Kaiqi NIU,He CHANG,Guangfu LYU,Pengyu ZHENG,Xueting CHI,Jia ZHOU,Yuchen WANG,Xiaowei HUANG. Inhibitory effect of astragaloside Ⅳ on cisplatin-induced liver injury in mice and its mechanism [J]. Journal of Jilin University(Medicine Edition), 2025, 51(2): 370-377. |
| [3] | Xiaoyan WANG,Xuelian LI,Bin LIANG,Wenfei TIAN,Hailin MA,Zhijing MO. Analysis on relationship between CALU and prognosis of hepatocellular carcinoma patients and its mechanism based on transcriptome and single cell sequencing data [J]. Journal of Jilin University(Medicine Edition), 2025, 51(2): 447-459. |
| [4] | Baolian MA,Xiaoxue HU,Xiaowen AI,Yonglan ZHANG. Inhibitory effect of diosmetin on ferroptosis of GC-2 spermatocytes induced by RSL3 in mice and its mechanism [J]. Journal of Jilin University(Medicine Edition), 2024, 50(6): 1481-1490. |
| [5] | Guobin HE,Huan WANG. Effect of knockdown of RIP3 on autophagy, pyroptosis, and ferroptosis of hypoxia/reoxygenation-induced human renal tubular epithelial HK2 cells [J]. Journal of Jilin University(Medicine Edition), 2024, 50(6): 1644-1653. |
| [6] | Fangyang JIANG,Jing XIAO,He CHANG,Mingyang SUN,Wenjing ZHANG,Guangfu LYU,He LIN,Zhe LIN,Xiaowei HUANG,Yuchen WANG. Effect of polygonatum odoratum polysaccharide on acute kidney injury in mice induced by cisplatin and its ferroptosis mechanism [J]. Journal of Jilin University(Medicine Edition), 2024, 50(5): 1235-1242. |
| [7] | Yanjue YE,Ziyi TANG,Yupei TAN,Shiying YANG,Yong LIU,Li YIN. Effect of azathioprine on ferroptosis in spermatocytes of mice induced by RSL3 [J]. Journal of Jilin University(Medicine Edition), 2024, 50(5): 1217-1226. |
| [8] | Xiaoyong PENG,Yu ZHU,Shuangbo ZHANG,Yingguo ZHU,Tao LI,Liangming LIU,Jianmin WANG,Guangming YANG. Alleviative effect of fluid resuscitation on damage of structure injury of vascular cells after blast injury complicated with hemorrhagic shock in rats by inhibiting ferroptosis of vascular tissue [J]. Journal of Jilin University(Medicine Edition), 2024, 50(5): 1227-1234. |
| [9] | Junping WEI,Dajia FU,Qingwen MENG,Daofei LIN,Yanzai LIN. Effect of bone marrow mesenchymal stem cell-derived exosomes on myocardial fibrosis in rats induced by isoproterenol and its mechanism [J]. Journal of Jilin University(Medicine Edition), 2024, 50(5): 1348-1357. |
| [10] | Yongjing YANG,Tianyang KE,Shixin LIU,Xue WANG,Dequan XU,Tingting LIU,Ling ZHAO. Synergistic sensitization of apatinib mesylate and radiotherapy on hepatocarcinoma cells invitro [J]. Journal of Jilin University(Medicine Edition), 2024, 50(4): 1009-1015. |
| [11] | Jinlian LI,Lanzhen HUANG,Xishi HUANG,Kangzhi LI,Jiali JIANG,Miaomiao ZHANG,Qunying WU. Bioinformatics analysis on key genes related to prognosis, diagnosis, and immune cell infiltration of hepatocellular carcinoma and their potential therapeutic drugs [J]. Journal of Jilin University(Medicine Edition), 2024, 50(4): 1062-1075. |
| [12] | Yingqun NI,Mao YANG,Di YANG,Chenglin GUO,Wenjun ZHU,Yaqin YU,Qin LU,Jinzhi LUO,Chunqin WU,Zhaohui FANG. Screening of key differentially expressed genes involved in osteogenic differentiation of lower limb vascular smooth muscle cells and validation [J]. Journal of Jilin University(Medicine Edition), 2024, 50(3): 620-627. |
| [13] | Xiaoyan WANG,Hao ZHANG,Zehao GUO,Jun CAO,Zhijing MO. Screening of UBE2S interacting protein and construction of prognostic model in hepatocellular carcinoma [J]. Journal of Jilin University(Medicine Edition), 2024, 50(1): 168-177. |
| [14] | Xiaopeng YU,Renyi YANG,Zuomei HE,Puhua ZENG. Establishment and validation of nomogram of cancer specific survival of patients with hepatocellular carcinoma with negative alpha fetoprotein based on SEER Database [J]. Journal of Jilin University(Medicine Edition), 2024, 50(1): 188-197. |
| [15] | Ruipeng ZHANG,Jie LI. Resistance and regeneration effects of lncRNA GPRC5D-AS1 on muscle atrophy of myocytes in mice induced by dexamethasone and its mechanism [J]. Journal of Jilin University(Medicine Edition), 2023, 49(6): 1457-1465. |
|
||