吉林大学学报(工学版) ›› 2025, Vol. 55 ›› Issue (3): 925-937.doi: 10.13229/j.cnki.jdxbgxb.20230576
基于极值理论与智能网联信息的超车风险评估
刘照霞1( ),付锐1,2(),牛世峰2
- 1.长安大学 汽车学院,西安 710064
2.长安大学 汽车学院,西安 710064
Risk assessment in overtaking scenarios using extreme value theory and intelligent and connected information
Zhao-xia LIU1(),Fui FU1,2(),Shi-feng NIU2
- 1.School of Automobile,Chang'an University,Xi'an 710064,China
2.School of Automobile,Chang'an University,Xi'an 710064,China
摘要:
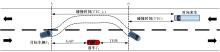
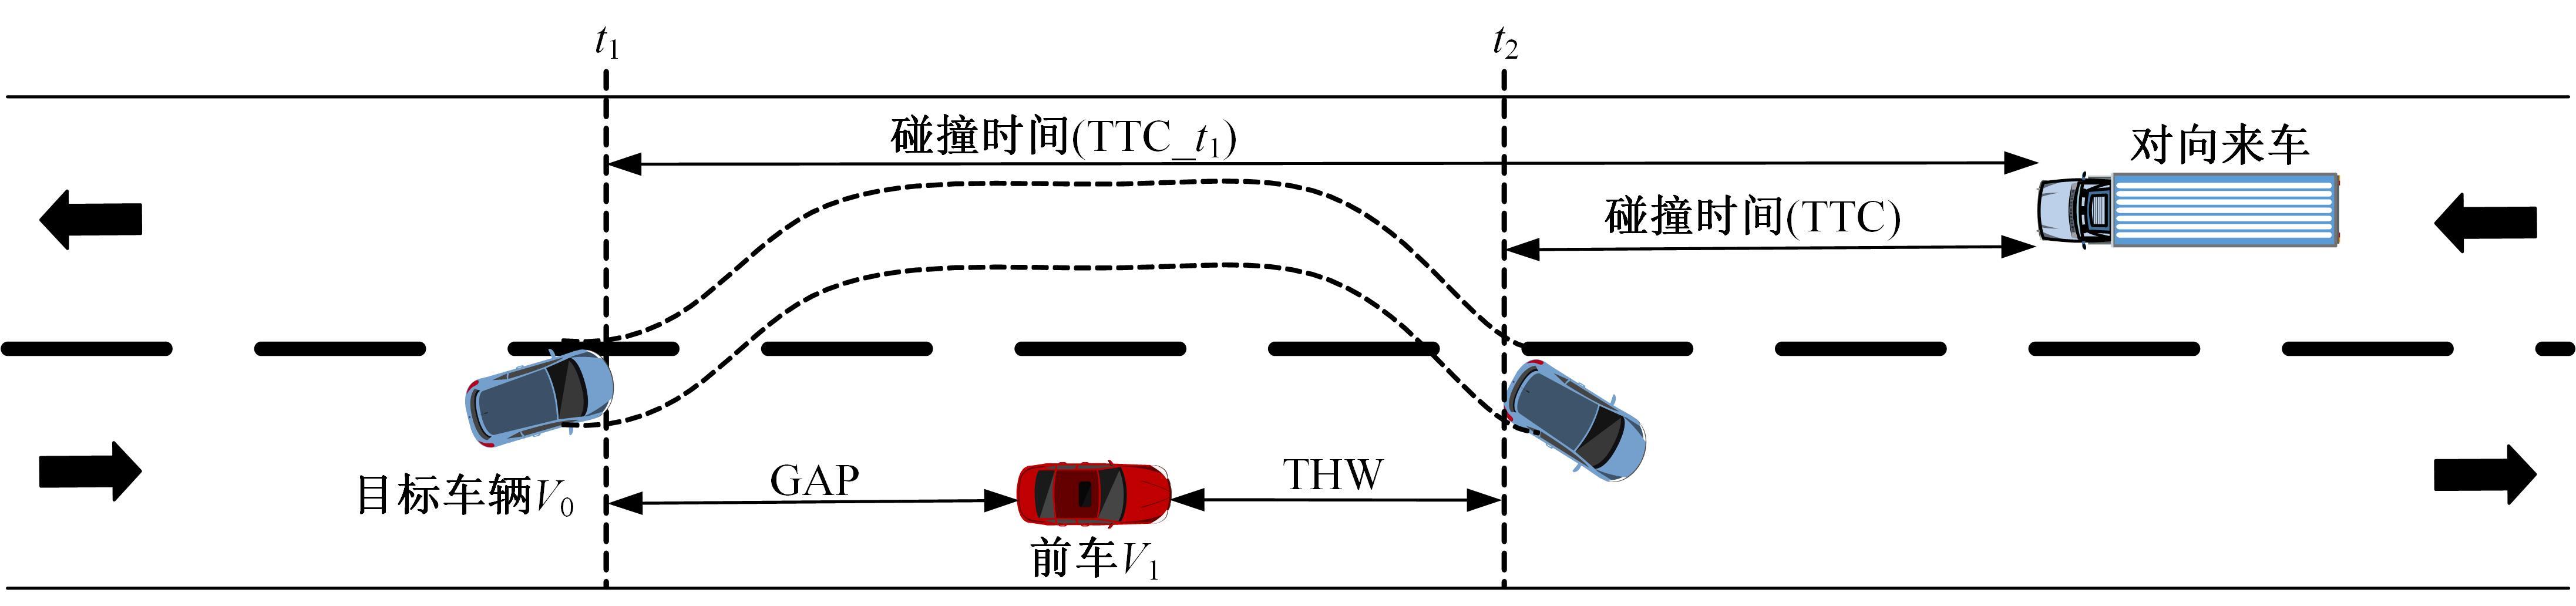
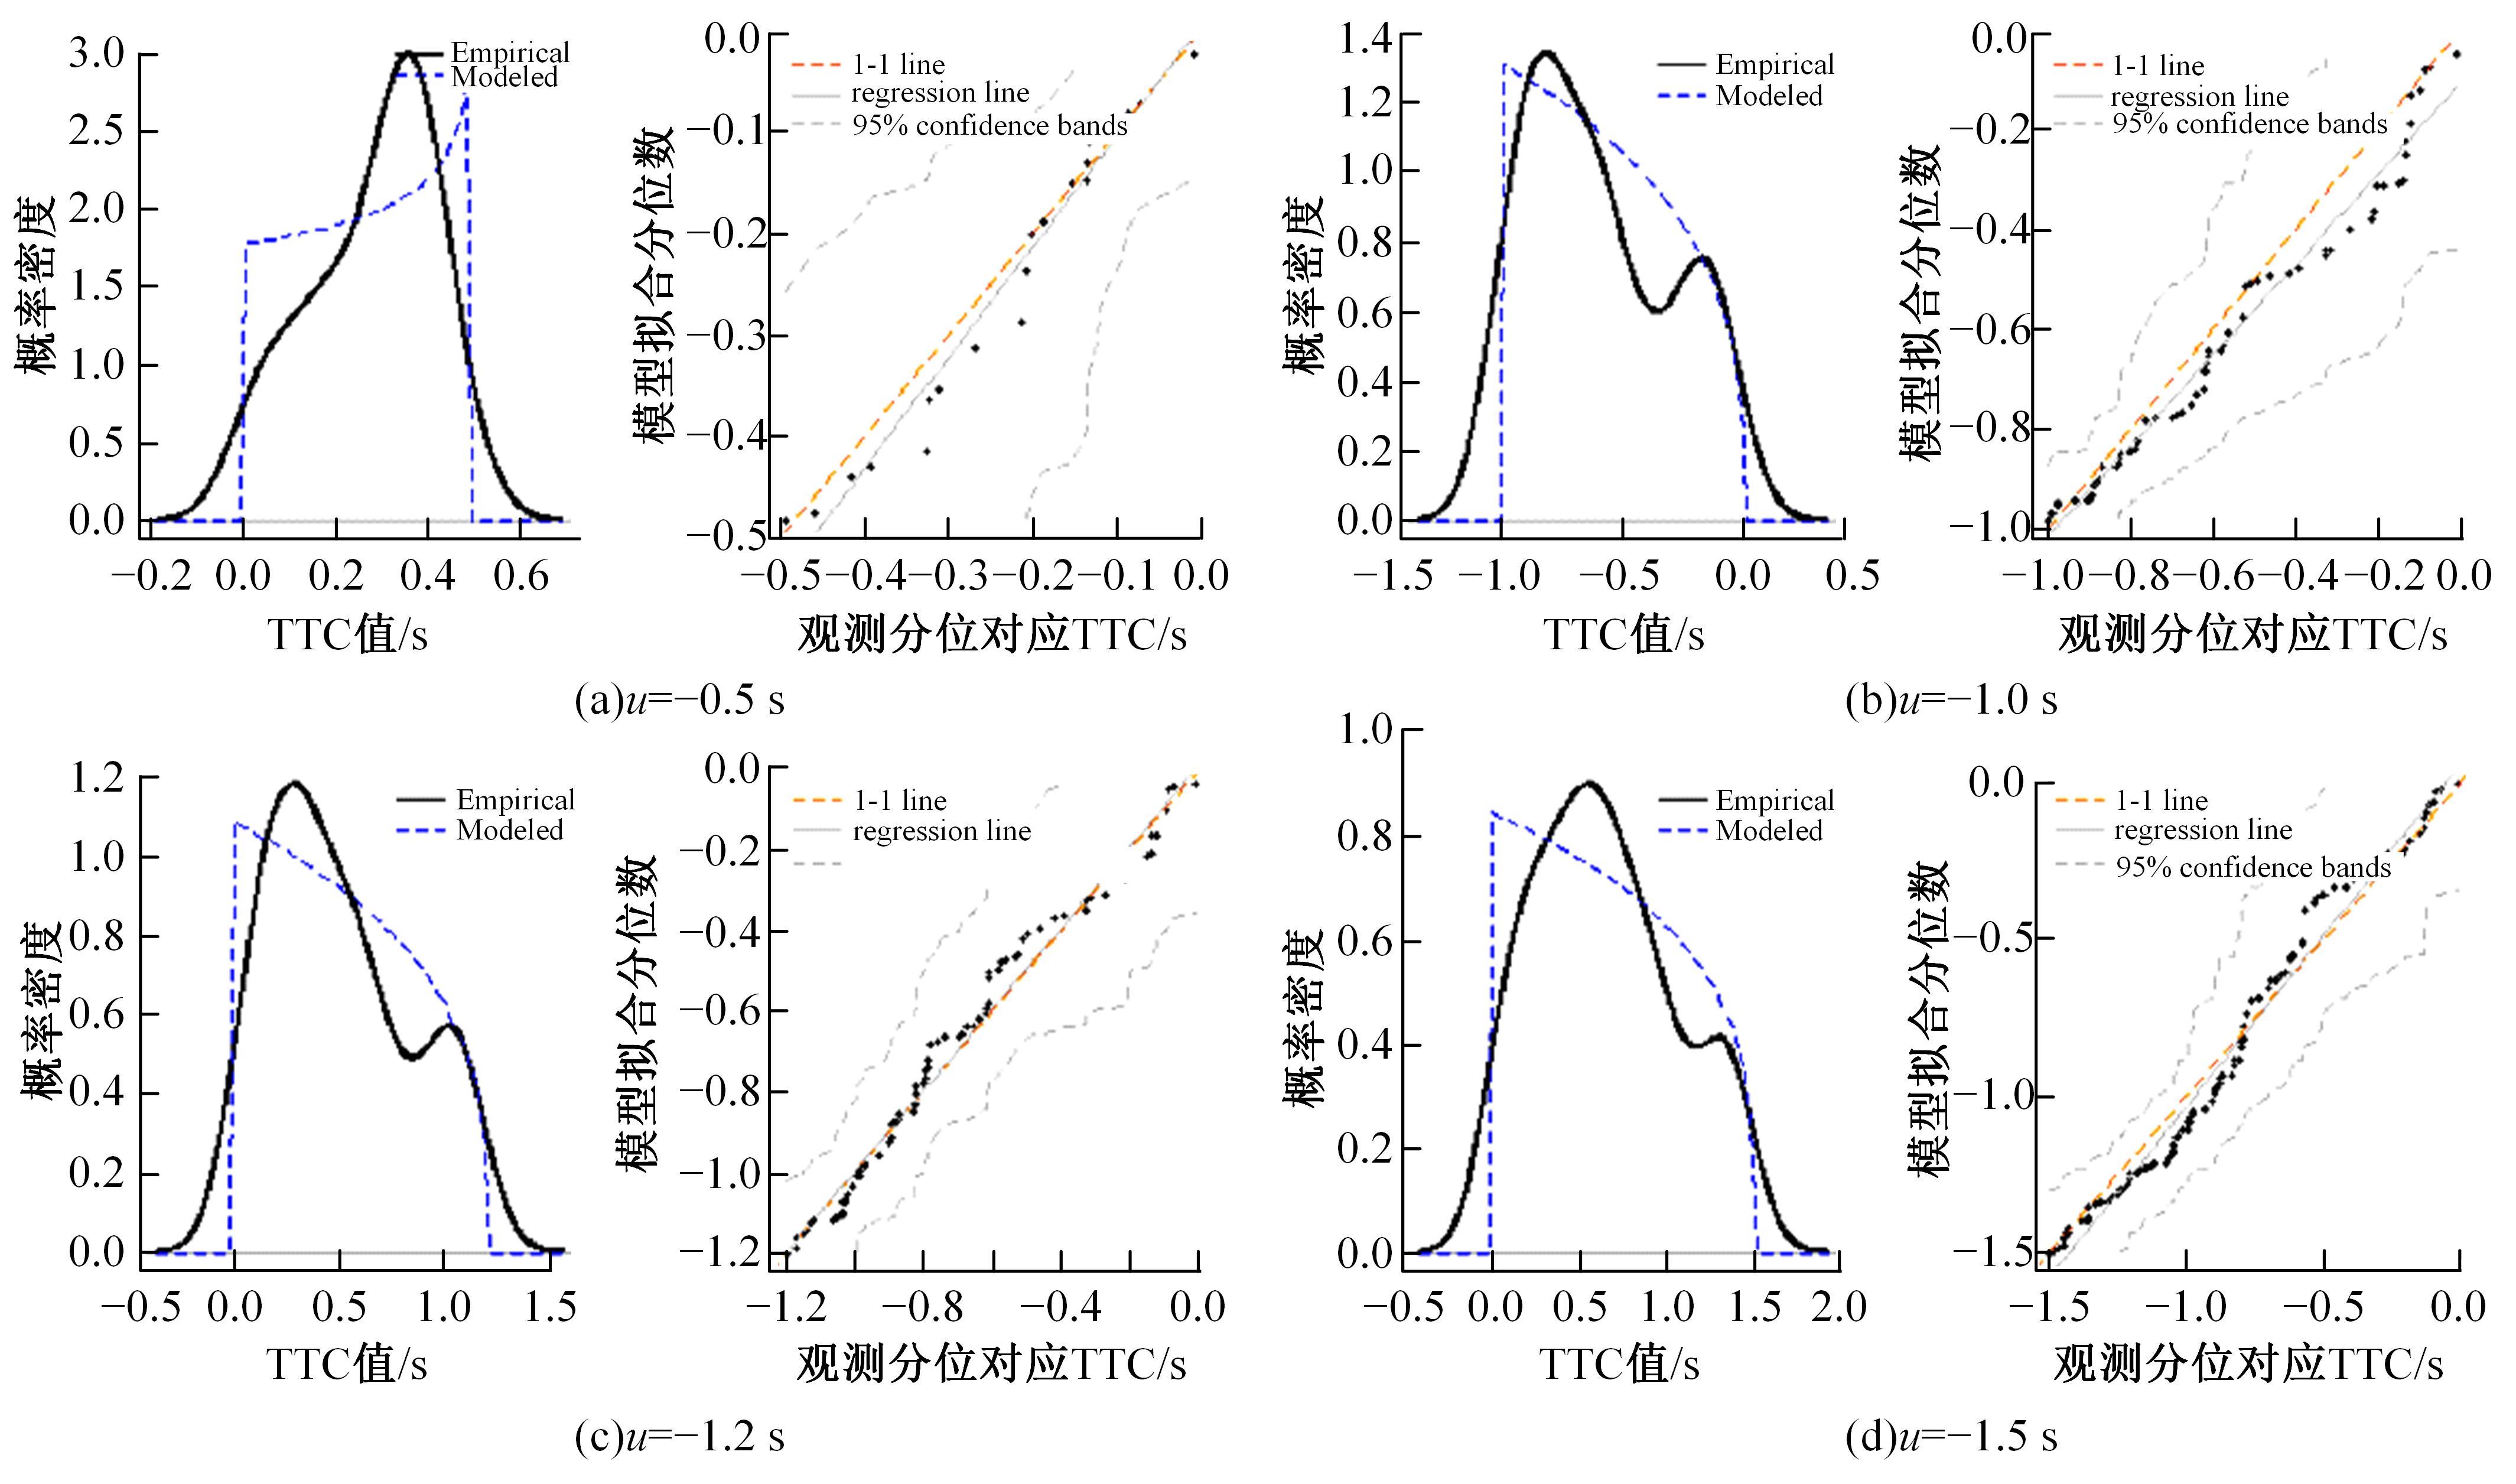
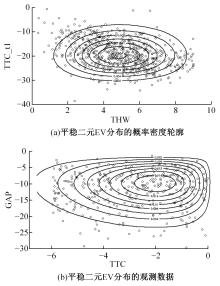
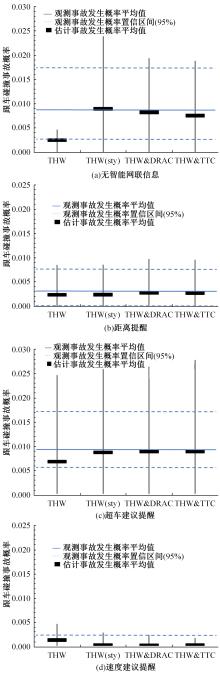
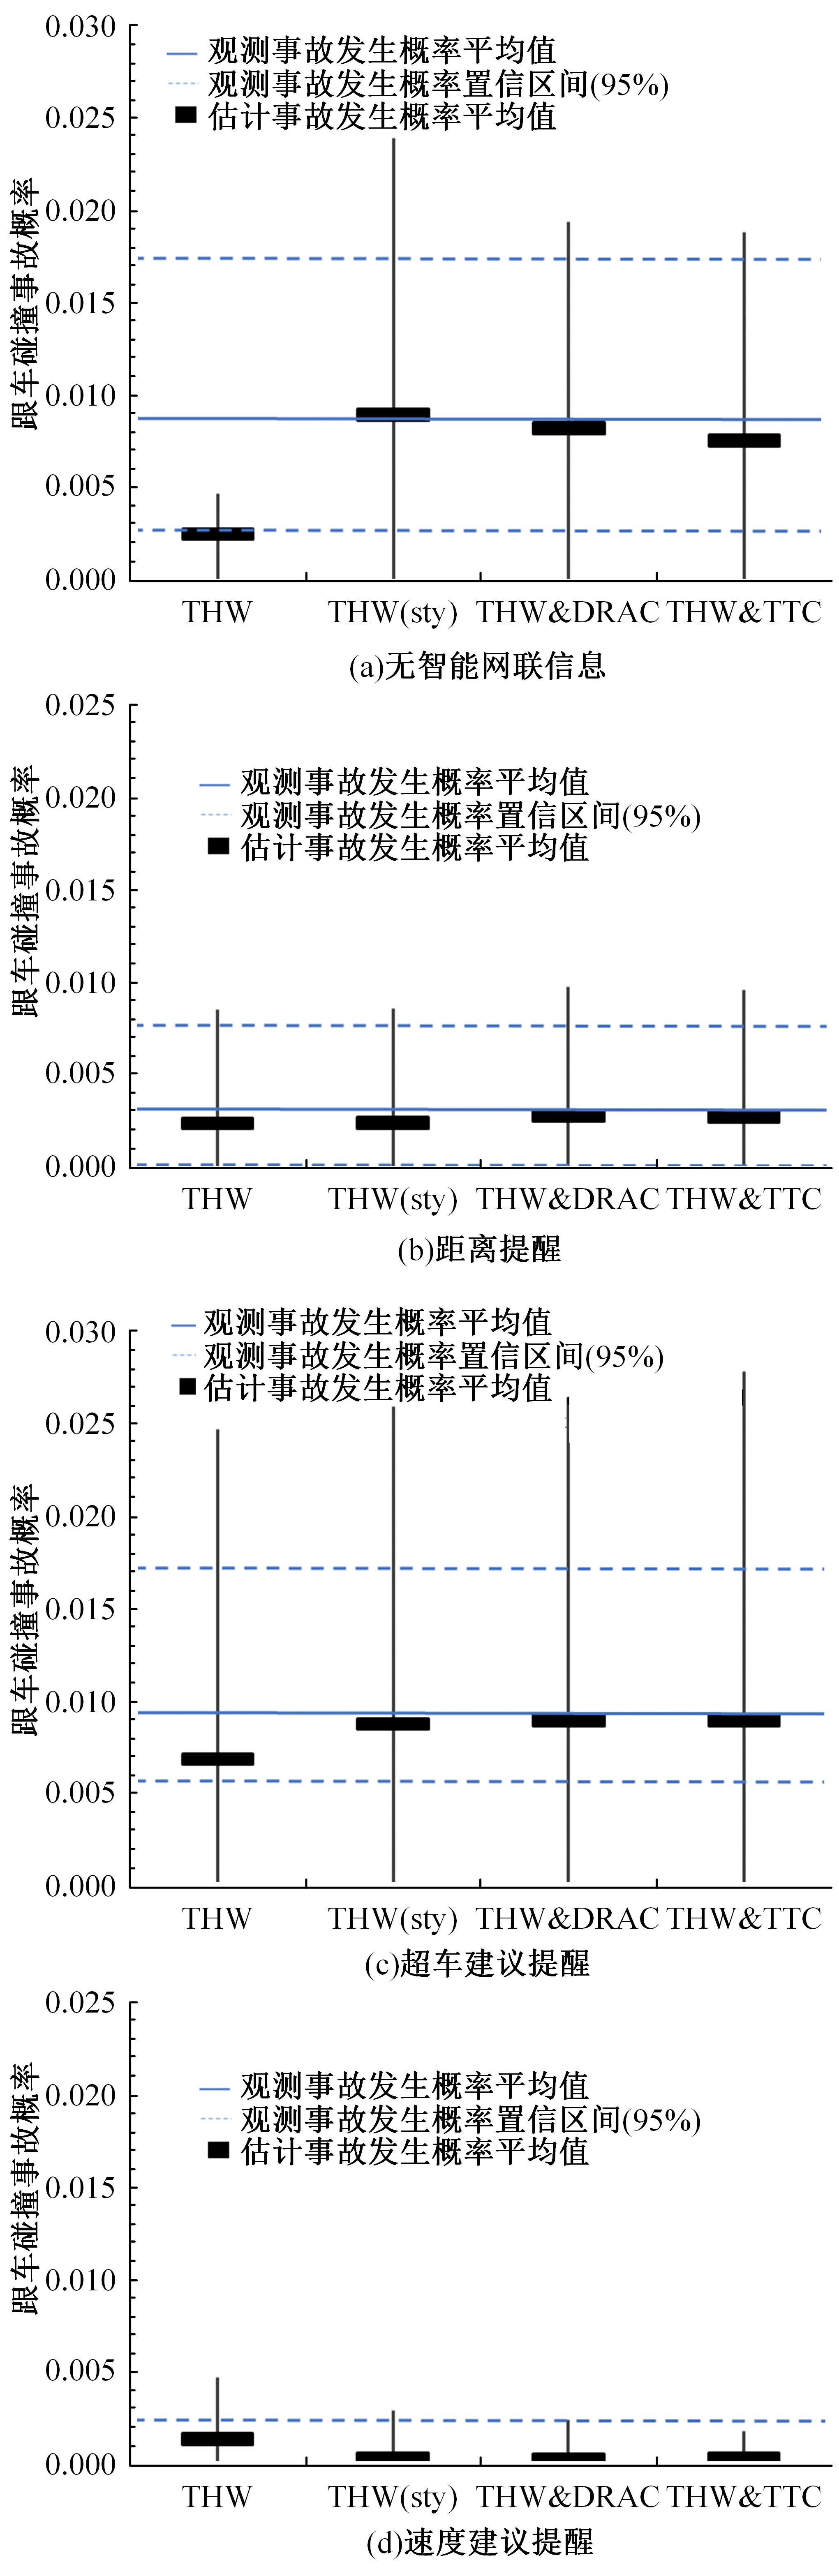
为评估智能网联汽车在提供不同网联信息时的超车风险水平,弥补传统风险评估对驾驶人因素的忽略以及单一交通冲突指标对复杂交通场景评价能力不足的问题,对超车事件中涉及的两种冲突场景(跟车冲突和正面来车冲突),分别引入块最大值(BM)和峰值超过阈值(POT)方法拟合极值分布,从而对超车时发生跟车事故、正面碰撞事故风险进行评估。在每种冲突场景中,构建了考虑驾驶人因素的非平稳极值模型和考虑不同交通冲突指标的二元极值模型,并通过双向二车道的智能网联汽车超车实验数据对模型进行验证。从原始实验数据中提取超车事件并计算冲突指标:包括超车事件开始时与前车的碰撞时间间隙GAP、与对向车辆的碰撞时间TTC_t1、避免碰撞的减速度(DRAC),以及超车事件结束时与对向车辆的碰撞时间(TTC)、与前车的车头时距(THW),以时间冲突指标为负或DRAC大于MADR的事件概率表征碰撞风险程度。结果表明:跟车冲突场景中,不同冲突指标构建的二元极值模型结果误差不同,其中THW&DRAC构建的二元极值模型评估结果最准确(标准误差MAE=0.000 28);正面来车冲突场景中TTC&DRAC构建的二元极值模型评估结果最准确(MAE=0.006)。在不同冲突场景中,考虑驾驶人因素的非平稳极值模型与不考虑驾驶人因素的模型相比显著提高了风险评估准确性(AIC、BIC值小)。此外,不同智能网联信息(实时距离、超车建议、速度建议)带来的超车风险不同,且当智能网联信息为速度建议时,车辆的超车风险最小。因此,本文所提考虑驾驶人因素的非平稳极值模型与二元极值模型可通过交通冲突指标有效评估驾驶风险。智能网联汽车的实验数据表明:本文模型可准确评估智能网联汽车在提供不同网联信息时的超车风险水平。
中图分类号:
- U491.3


| 1 | 朱顺应, 蒋若曦, 王红, 等. 机动车交通冲突技术研究综述[J]. 中国公路学报, 2020, 33(2): 15-33. |
| Zhu Shun-ying, Jiang Ruo-xi, Wang Hong, et al. Review of research on traffic conflict techniques[J]. China Journal of Highway and Transport, 2020, 33(2): 15-33. | |
| 2 | Zheng L, Ismail K, Meng X. Freeway safety estimation using extreme value theory approaches: a comparative study[J]. Accident Analysis & Prevention, 2014, 62: 32-41. |
| 3 | Mahmud S M, Ferreira L, Hoque M D, et al. Application of proximal surrogate indicators for safety evaluation: a review of recent developments and research needs[J]. IATSS Research, 2017, 41(4): 153-163. |
| 4 | Johnsson C, Laureshyn A, Ceunynck T, et al. In search of surrogate safety indicators for vulnerable road users: a review of surrogate safety indicators[J]. Transp Rev, 2018, 38(6): 765-785. |
| 5 | Zheng L, Ismail K, Meng X H, et al. Traffic conflict techniques for road safety analysis: open questions and some insights[J]. Canadian Journal of Civil Engineering, 2014, 41(7): 633-641. |
| 6 | Zheng L, Sayed T. Application of extreme value theory for before-after road safety analysis[J]. Transportation Research Record, 2019, 2673: 1001-1010. |
| 7 | Archer J. Methods for the assessment and prediction of traffic safety at urban intersections and their application in micro-simulation modelling[D]. Stockholm:Royal Institute of Technology, 2004. |
| 8 | Coles S G. An introduction to statistical modeling of extreme values[M]. London: Springer-Verlag, 2001. |
| 9 | Åsljung, D, Nilsson J, Fredriksson J. Using extreme value theory for vehicle level safety validation and implications for autonomous vehicles[J]. IEEE Transactions on Intelligent Vehicles, 2017, 2(4): 288-297. |
| 10 | 王晨, 夏井新, 陆振波, 等. 基于微观仿真与极值理论的城市交叉口安全评价方法[J]. 中国公路学报, 2018, 31(4): 288-295, 303. |
| Wang Chen, Xia Jing-xin, Lu Zhen-bo, et al. Safety evaluation method based on traffic simulation and extreme value theory[J]. China Journal of Highway and Transport, 2018, 31(4): 288-295, 303. | |
| 11 | Zheng L, Sayed T. Bayesian hierarchical modeling of traffic conflict extremes for crash estimation: a non-stationary peak over threshold approach[J]. Analytic Methods in Accident Research, 2019, 24: No.100106. |
| 12 | Zheng L, Sayed T. A bivariate Bayesian hierarchical extreme value model for traffic conflict-based crash estimation[J]. Analytic Methods in Accident Research, 2020, 25: No.100111. |
| 13 | Mannering F L, Shankar V, Bhat C R. Unobserved heterogeneity and the statistical analysis of highway accident data[J]. Analytic Methods in Accident Research, 2016, 11:1-16. |
| 14 | Wang C, Xu C, Xia J, et al. A combined use of microscopic traffic simulation and extreme value methods for traffic safety evaluation[J]. Transportation Research Part C, 2018, 90: 281-291. |
| 15 | Zheng L, Sayed T. From univariate to bivariate extreme value models: approaches to integrate traffic conflict indicators for crash estimation[J]. Transportation Research Part C, 2019, 103: 211-225. |
| 16 | Zheng L, Ismail K, Meng X. Freeway safety estimation using extreme value theory approaches: a comparative study[J]. Accident Analysis and Prevention, 2014, 62: 32-41. |
| 17 | Farah H, Azevedo C L. Safety analysis of passing maneuvers using extreme value theory[J]. IATSS Research, 2017, 41(1): 12-21. |
| 18 | Ismail K, Sayed T, Saunier N. Methodologies for aggregating indicators of traffic conflict[J]. Transportation Research Record, 2011, 2217: 10-19. |
| 19 | Wang C, Xu C, Dai Y. A crash prediction method based on bivariate extreme value theory and video-based vehicle trajectory data[J]. Accident Analysis and Prevention, 2019, 123: 365-373. |
| 20 | Useche S A, Cendales B, et al. Validation of the multidimensional driving style inventory (MDSI) in professional drivers: how does it work in transportation workers?[J]. Transportation Research Part F: Traffic Psychology and Behaviour, 2019, 67: 155-163. |
| [1] | 潘义勇,尤逸文,吴静婷. 换道事故严重程度影响因素异质性和可转移性分析[J]. 吉林大学学报(工学版), 2025, 55(2): 520-528. |
| [2] | 王宏志,宋明轩,程超,解东旋. 基于改进YOLOv5算法的道路目标检测方法[J]. 吉林大学学报(工学版), 2024, 54(9): 2658-2667. |
| [3] | 戢晓峰,徐迎豪,普永明,郝京京,覃文文. 山区双车道公路货车移动遮断小客车跟驰风险预测模型[J]. 吉林大学学报(工学版), 2024, 54(5): 1323-1331. |
| [4] | 邬岚,赵乐,李根. 基于方差异质性随机参数模型的汇合行为分析[J]. 吉林大学学报(工学版), 2024, 54(4): 883-889. |
| [5] | 王宏志,宋明轩,程超,解东旋. 基于改进YOLOv4-tiny算法的车距预警方法[J]. 吉林大学学报(工学版), 2024, 54(3): 741-748. |
| [6] | 何杰,张长健,严欣彤,王琛玮,叶云涛. 基于微观动力学参数的高速公路特征路段事故风险分析[J]. 吉林大学学报(工学版), 2024, 54(1): 162-172. |
| [7] | 潘恒彦,张文会,梁婷婷,彭志鹏,高维,王永岗. 基于MIMIC与机器学习的出租车驾驶员交通事故诱因分析[J]. 吉林大学学报(工学版), 2023, 53(2): 457-467. |
| [8] | 贺宜,孙昌鑫,彭建华,吴超仲,江亮,马明. 电动载货三轮车风险行为及影响因素分析[J]. 吉林大学学报(工学版), 2023, 53(2): 413-420. |
| [9] | 朱洁玉,马艳丽. 合流区域多车交互风险实时评估方法[J]. 吉林大学学报(工学版), 2022, 52(7): 1574-1581. |
| [10] | 彭涛,方锐,刘兴亮,王海玮,庞彦伟,许洪国,刘福聚,王涛. 基于典型事故场景的雪天高速换道自动驾驶策略[J]. 吉林大学学报(工学版), 2022, 52(11): 2558-2567. |
| [11] | 程国柱,程瑞,徐亮,张文会. 基于乘员伤害分析的公路路侧事故风险评价[J]. 吉林大学学报(工学版), 2021, 51(3): 875-885. |
| [12] | 王露,刘玉雯,陈红. 侧风下峡谷桥隧连接段汽车的行驶特性[J]. 吉林大学学报(工学版), 2019, 49(3): 736-748. |
| [13] | 代存杰,李引珍,马昌喜,柴获,牟海波. 不确定条件下危险品配送路线多准则优化[J]. 吉林大学学报(工学版), 2018, 48(6): 1694-1702. |
| [14] | 王芳荣, 郭柏苍, 金立生, 高琳琳, 岳欣羽. 次任务驾驶安全评价指标筛选及其权值计算[J]. 吉林大学学报(工学版), 2017, 47(6): 1710-1715. |
| [15] | 谭立东, 刘丹, 李文军. 基于蝇复眼的交通事故现场全景图像阵列仿生设计[J]. 吉林大学学报(工学版), 2017, 47(6): 1738-1744. |
|
||